A late-summer swoon for stocks? Maybe not this year
Key takeaways:
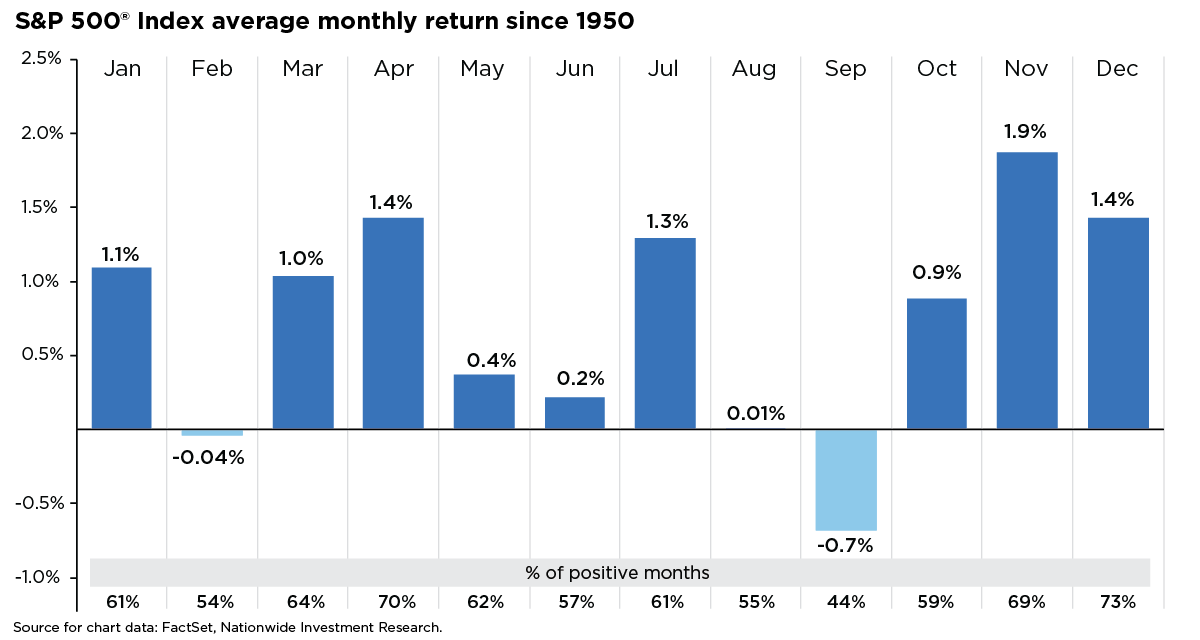
- August and September have historically been among the weakest months for equities, but several indicators suggest the market may offset near-term softness.
- The current rally is not limited to a narrow group of leading stocks; instead, it reflects broader participation across sectors, adding strength and resilience to the trend.
08/06/2025 – The stock market rally over the past 79 days—since the April 8 low—has been notable, with the S&P 500® Index climbing over 28%. Contributing factors include easing tariff concerns, upward revisions to corporate earnings, and a rebound in second-quarter GDP growth to 3% year-over-year.
While the intermediate-term outlook remains constructive, the market is entering a seasonally fragile period. Historically, August and September rank among the weakest months for equities (see accompanying chart). Past performance during similar windows suggests the potential for a near-term pause or modest pullback.
What distinguishes the current environment is the broad participation in market gains—an often-overlooked indicator that may help temper typical late-summer softness. While some near-term exhaustion in the rally is possible, the longer-term outlook remains constructive. Improving breadth and solid corporate fundamentals suggest the market may be more inclined to merge recent gains rather than enter a correction, especially if momentum fades in the coming months.
What sets the current environment apart is the breadth of participation in the market’s gains—an often-overlooked indicator that could help offset typical seasonal weakness. Unlike rallies driven by a narrow group of leaders, this one has drawn strength from a wider range of stocks. Most S&P 500 sectors have taken part, lifting the equal-weighted index to its first record high since November 2024.
Technical indicators in July pointed to encouraging momentum, which may help cushion any potential market pullback in August. While the percentage of S&P 500 stocks trading above their 50- and 100-day moving averages has dipped below the 70% threshold seen earlier in the month, it remains broadly supportive of the market’s upward trend. Notably, the S&P 500 closed above its 20-day moving average for 67 consecutive sessions in July—the longest streak since 1997. Additionally, July saw 30 straight trading days where new highs outpaced new lows on both the NYSE and NASDAQ, signaling strong market breadth.
The market’s soft start to August is a timely reminder that, even amid strong momentum, equities rarely move in a straight line. Corrections and pauses are not only expected—they’re a healthy part of market behavior. Current signals suggest that any near-term weakness tied to seasonality is likely to be shallow and rotational, presenting an opportunity to reallocate toward equities rather than retreat from them.
Author(s)

Mark Hackett, CFA®, CMT®, CFP®
Chief Market Strategist, Nationwide Investment Management Group
Mark Hackett is the Chief Market Strategist for Nationwide’s Investment Management Group, bringing more than 20 years of experience in the asset management industry to the role.
Trending articles
In the coming years, more people will begin to think about the costs of health care in retirement and the possibility of needing long-term care (LTC) in the future, especially as the number of Americans reaching age 65 hits an all-time high this year.
Considerations for financial professionals on supporting retirees through economic uncertainty.
This guide explores strategies for securing long-term care for children with special needs through special needs trusts, ABLE accounts, and government benefits.