Are stocks overbought? How technical indicators
can help guide investors
Key takeaways:
- Momentum has driven this year’s market rally—but after strong returns, is it poised to persist or due for a pause?
- Technical signals of overbought conditions may point to a short-term consolidation—but they could also suggest momentum has room to run over the longer term.
10/01/2025 – Since the April 8th low, the S&P 500® Index has climbed over 30%, and markets have largely shrugged off this year’s brief turbulence. But with macro uncertainties still in play—including the risk of a federal government shutdown—many investors are asking: can the rally keep going?
Momentum has arguably defined this rally—driven by stronger-than-expected corporate results, upward earnings revisions, and fading volatility. Yet investor sentiment remains surprisingly subdued, which, under typical conditions, might serve as a contrarian indicator against continued bullishness. Still, no rally is without technical signals worth watching.
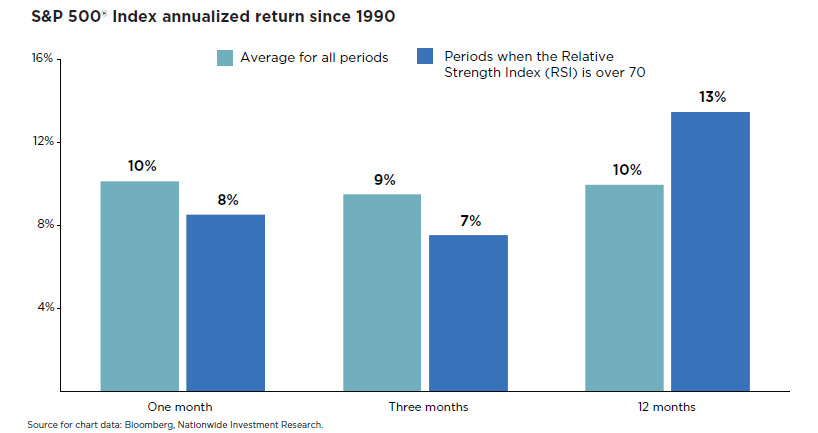
One such signal is the 14-Day Relative Strength Index (RSI), which tracks the speed and magnitude of recent price movements on a scale from 0 to 100. It’s commonly used to gauge whether a security—or the broader market, like the S&P 500—is overbought or oversold. Readings above 70 typically suggest overbought conditions.
The S&P 500’s RSI has topped 70 several times during this year’s rally—a level often associated with overbought conditions. While an elevated RSI doesn’t guarantee a reversal, history suggests it can signal short-term consolidation or a pause in momentum. Given the rally’s strength, a pullback wouldn’t be surprising—and is part of a healthy bull market, not a breakdown.
Elevated RSI doesn’t always point to exhaustion—it can also reflect sustained momentum. As the accompanying chart shows, when the S&P 500’s RSI has crossed 70 (going back to 1990), returns over the next month have typically lagged the Index’s monthly average by about 2% annualized. But zoom out to the following 12 months, and the story shifts: those same periods have outperformed the average by roughly 3% annualized. In other words, momentum has often carried the market higher.
In the current bull market, overbought signals from RSI may paint a misleading picture of investor positioning. Equity exposure remains neutral at best, and while sentiment is moderately bullish, it’s far from euphoric. Combined with a supportive backdrop, this suggests the rally may still have room to run. For financial professionals, technical metrics like momentum should never be viewed in isolation. They’re most useful when considered within the broader context of a client’s investment plan. Portfolio allocation decisions should also weigh historical precedent, business cycle dynamics, market internals, underlying fundamentals, and other factors—forming a weight-of-the-evidence approach to portfolio construction.
Author(s)

Mark Hackett, CFA®, CMT®, CFP®
Chief Market Strategist, Nationwide Investment Management Group
Mark Hackett is the Chief Market Strategist for Nationwide’s Investment Management Group, bringing more than 20 years of experience in the asset management industry to the role.
Trending articles
In the coming years, more people will begin to think about the costs of health care in retirement and the possibility of needing long-term care (LTC) in the future, especially as the number of Americans reaching age 65 hits an all-time high this year.
Considerations for financial professionals on supporting retirees through economic uncertainty.
This guide explores strategies for securing long-term care for children with special needs through special needs trusts, ABLE accounts, and government benefits.