Boom or bubble? Weighing AI hype
against market fundamentals
Key takeaways:
- The AI rally has sparked bubble concerns, but strong fundamentals suggest it may be more sustainable than speculative.
- There are echoes of the 1990s dot-com bubble, but while market cycles may rhyme, they rarely repeat.
10/15/2025 – Speculation about a potential AI-driven bubble is surfacing across Wall Street, as the blistering rally in equities prompts a closer look at the underlying fundamentals. Since the November 2022 debut of OpenAI’s ChatGPT, the tech-heavy Nasdaq Composite Index has surged over 100% through October 8, 2025. Technology stocks within the S&P 500® Index have followed a similar trajectory. More recently, since the market’s low on April 8, momentum has remained striking: the Nasdaq is up roughly 50%, while the S&P 500 technology sector has climbed 62%.
Given the sheer velocity of the recent rally, many clients may now wonder: have markets run too far, too fast? While the AI surge has sparked bubble concerns, strong fundamentals—like robust earnings growth and healthy free cash flow margins—suggest the rally may be more grounded than speculative.
Bubble concerns are further amplified by the increasingly complex web of AI-related financing—structures that, to some investors, echo the “vendor financing” practices of the 1990s. Consider a few recent headlines: Nvidia has pledged up to $100 billion in investments tied to OpenAI; OpenAI has signed a $300 billion cloud services agreement with Oracle; Oracle is spending tens of billions on Nvidia chips; and AMD is deploying gigawatts of GPUs, with equity options embedded in the deal.
This tightly interwoven financial structure—driven by aggressive capital spending and lofty growth assumptions—bears the hallmarks of classic bubble behavior, especially in the absence of clear long-term earnings visibility. If free cash flow growth among these firms slows or turns negative, valuations could come under pressure and investor sentiment toward AI may quickly deflate. Adding to the risk is the nature of capital expenditures themselves: multi-year commitments made in pursuit of productivity gains, often tied to technologies whose real-world applications are still in their early stages.
There are clear echoes of the late-1990s dot-com bubble—both in investor sentiment and speculative positioning. But while market cycles often rhyme, they rarely repeat in the same way. One key difference: today’s AI rally is underpinned by real earnings growth, unlike the profitless exuberance of the dot-com era. Technology and communication services now make up a record 44.9% of the S&P 500’s market capitalization and an unprecedented 37.4% of its forward earnings. By comparison, at the peak of the tech bubble in 1999–2000, those sectors accounted for 40.7% of the Index’s market cap but just 23.8% of its forward earnings.
While profitability comparisons to the dot-com era are common, they often overlook a key metric: free cash flow (FCF) margin. Today, the S&P 500 technology sector boasts an FCF margin of approximately 20%—more than double the levels seen in the late 1990s and early 2000s. Although pockets of froth remain, particularly among speculative AI-adjacent names, the data suggests that hyperscalers are the true engines of the current rally. These firms are backed by fortress balance sheets, strong margins, and consistent revenue and earnings growth.
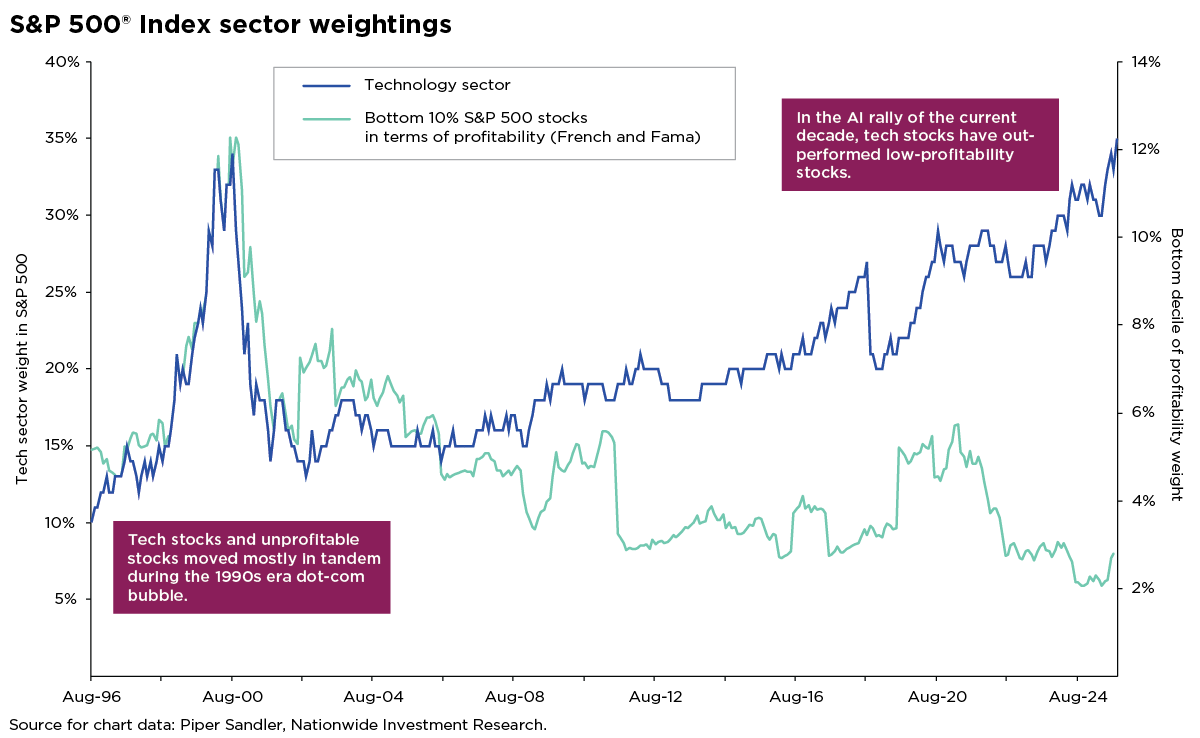
A recent comparison of sector weights highlights a key divergence from the dot-com era: today’s tech sector dominance in the S&P 500 has far outpaced that of low-quality, unprofitable stocks. (See accompanying chart.) In the late 1990s, both moved in tandem—fueling the bubble. Today, it’s a different story. The so-called “Magnificent 7” have delivered year-over-year earnings growth of 27% in Q1 and 26% in Q2, with Q3 estimates pointing to another 14% gain. That is just 5% growth for the remaining 493 companies in the Index. Unlike many dot-com darlings, these firms are not only profitable—they’re driving the market’s earnings engine.
As we enter Q3 earnings season, the technology sector is expected to deliver 22% EPS growth alongside 14.8% top-line revenue growth—hardly the fundamentals that signal frothy conditions. While the bubble warrants careful analysis, advisors can better serve clients by helping them avoid overreacting to short-term market swings. Instead, encourage clients to stay grounded in fundamentals, diversify across sectors and styles, and remain focused on valuation and cash flow dynamics throughout the cycle.
Author(s)

Mark Hackett, CFA®, CMT®, CFP®
Chief Market Strategist, Nationwide Investment Management Group
Mark Hackett is the Chief Market Strategist for Nationwide’s Investment Management Group, bringing more than 20 years of experience in the asset management industry to the role.
Trending articles
In the coming years, more people will begin to think about the costs of health care in retirement and the possibility of needing long-term care (LTC) in the future, especially as the number of Americans reaching age 65 hits an all-time high this year.
Considerations for financial professionals on supporting retirees through economic uncertainty.
This guide explores strategies for securing long-term care for children with special needs through special needs trusts, ABLE accounts, and government benefits.