Bulls and bears set the scene
for the blockbuster stock rally
Key takeaways:
- While stocks have rebounded from their April lows, signals from both bullish and bearish perspectives point to a less favorable risk/reward setup in the near term.
- Investors may benefit from a more cautious stance, approaching the recent momentum in the stock market with measured optimism.
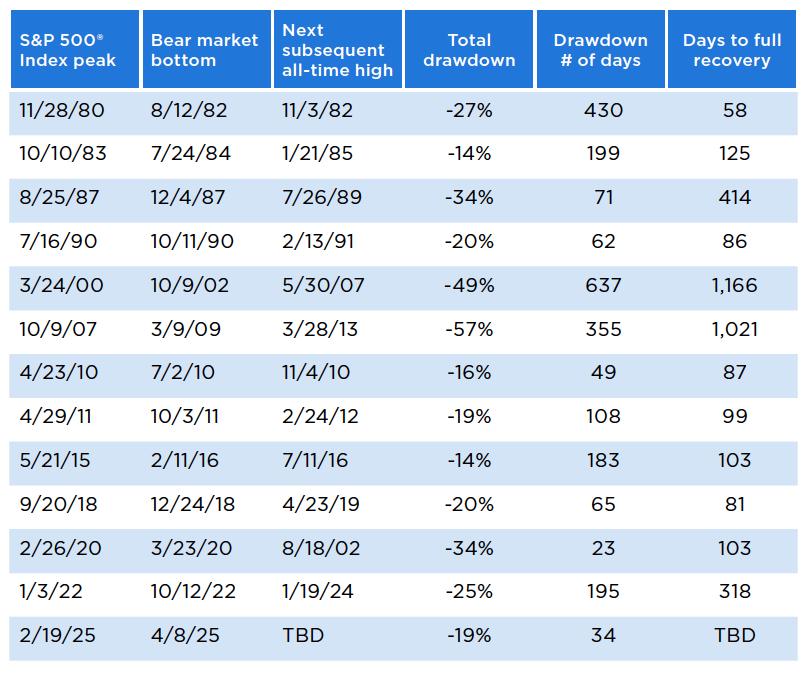
05/21/2025 – Market narratives rarely follow a straight path—more like a Hollywood thriller than a textbook. In early April, the S&P 500® Index dropped nearly 19% in just 34 days, flirting with bear market territory. Just as investors were bracing for the worst, the story took a sharp turn. Bulls charged back, and stocks rallied. The S&P 500 is now in positive territory for the year, though it still trails its all-time high from February 19.
The Index has also climbed back above its 200-day moving average—a signal many view as constructive. Still, the recent tug-of-war between bulls and bears points to a more nuanced backdrop. Despite the impressive rally, the S&P 500's valuation has surged to 21x forward earnings, driven entirely by multiple expansion, nearing its 2024 peak of 22x. As a result, the current risk/reward setup appears less interesting. A more cautious stance may be appropriate as markets digest recent gains.
The bears, undeterred by the recent rally, contend that risk sentiment remains highly susceptible to tariff developments. Meanwhile, the bulls argue that peak uncertainty and improving trade dynamics significantly reduce the likelihood of the market retesting its April 7 lows. While the bears assert that the exuberant rally since those lows lacks technical merit and reflects speculative fervor poised for retracement, the bulls counter with a robust defense. They point out that price momentum leading into the April 8 rebound was historically oversold, marked by extreme, indiscriminate selling and washed-out market breadth—conditions that often precede a reversal. Additionally, contrarian levels of bearish sentiment, reflected in indicators like the CBOE Volatility Index (VIX) and the AAII survey, suggested the market was likely oversold.
While the bulls’ arguments are certainly persuasive, the bears offer a critical counterpoint. They contend that even if tariffs are rolled back, they’re likely to remain elevated compared to historical norms—continuing to squeeze corporate margins. At the same time, earnings estimates are weakening across market caps, and high valuations pose a challenge amid an uncertain macro backdrop.
Both sides present strong cases, but the next chapter in the market’s 2025 story remains unwritten. Rather than getting caught up in the daily twists and turns of competing narratives, investors may be better served by maintaining a long-term perspective and staying committed to a strategy aligned with their broader financial goals.
Author(s)

Mark Hackett, CFA®, CMT®, CFP®
Chief Market Strategist, Nationwide Investment Management Group
Mark Hackett is the Chief Market Strategist for Nationwide’s Investment Management Group, bringing more than 20 years of experience in the asset management industry to the role.
Trending articles
In the coming years, more people will begin to think about the costs of health care in retirement and the possibility of needing long-term care (LTC) in the future, especially as the number of Americans reaching age 65 hits an all-time high this year.
Considerations for financial professionals on supporting retirees through economic uncertainty.
This guide explores strategies for securing long-term care for children with special needs through special needs trusts, ABLE accounts, and government benefits.