Calm above, turbulence below:
A market shaped by sector rotations
Key takeaways:
- A tight S&P 500® Index and wide stock moves signal a stock-picker’s market.
- Rotation trends remain mixed and hard to read.
02/25/2026 – Through mid-February, the S&P 500® Index was flat for the year, but that calm headline masked a more active market beneath the surface. In reality, this has been one of the busiest stretches for equities in recent years, defined by sharp sector rotations and pronounced single-stock moves—conditions that look nothing like a stable or orderly market.
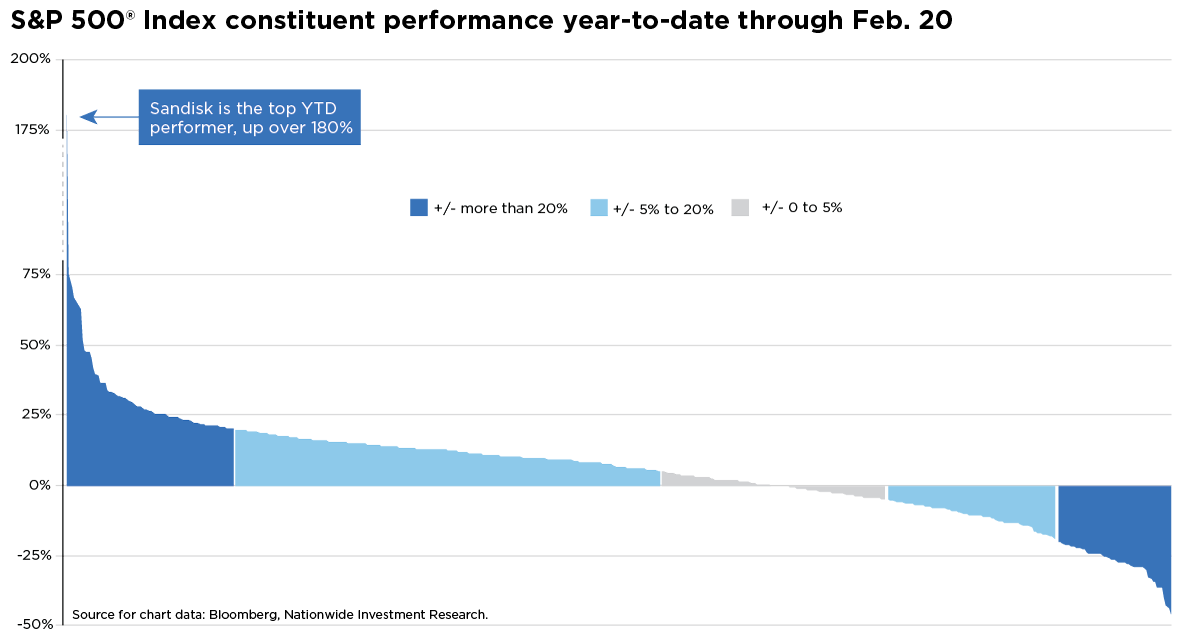
This week’s chart highlights just how wide that dispersion has become. As of this writing—and as Bespoke Investment Group noted—roughly 101 companies in the S&P 500 are up or down less than 5% year-to-date, while about 128 stocks have already moved more than 20% in either direction.
Taken together, these dynamics point to a market defined by wide return dispersion paired with unusually low correlation. For context, the S&P 500 has rarely traded in such a tight range year-to-date—something we’ve seen only a few times historically, most notably in 1964 and 1966. At the same time, single-stock volatility remains elevated, with the average company in the Index already moving about 14% this year.
The combination of an unusually constrained Index and unusually explosive single-stock action suggests that 2026 could shape up to be a stock-picker’s market. But the dispersion isn’t incidental—it reflects a market wrestling with competing forces that lack a clean resolution. Cyclical areas continue to draw strong momentum, even as capital rotates toward more defensive sectors at the same time, underscoring how mixed the underlying signals remain.
Investors may struggle to tell whether these rotations are brief bursts of repositioning or the early stages of a structural shift, especially since they’re happening simultaneously. That uncertainty contributes to an environment where the dominant narratives can change quickly—and often with little warning.
And because technology stocks now make up roughly one-third of the S&P 500 by weight, the investment flows out of the sector since last October have likely limited the Index’s ability to push to new highs. Tech breadth also remains weak, with fewer names trading above their 200-day moving averages. That backdrop helps explain why valuations across the sector have compressed since last fall.
In contrast, energy and consumer staples have built meaningful momentum in recent weeks. But because these sectors together represent only about 8% of the S&P 500, their combined strength isn’t enough to offset weakness in technology—or to meaningfully propel the Index toward new highs.
For investors, this kind of environment calls for discipline. Maintaining broad diversification, rebalancing when positions drift, and staying anchored to long-term objectives remain the most effective ways to navigate short-term noise and rapidly shifting narratives.
Author(s)

Mark Hackett, CFA®, CMT®, CFP®
Chief Market Strategist, Nationwide Investment Management Group
Mark Hackett is the Chief Market Strategist for Nationwide’s Investment Management Group, bringing more than 20 years of experience in the asset management industry to the role.
Trending articles
In the coming years, more people will begin to think about the costs of health care in retirement and the possibility of needing long-term care (LTC) in the future, especially as the number of Americans reaching age 65 hits an all-time high this year.
Considerations for financial professionals on supporting retirees through economic uncertainty.
This guide explores strategies for securing long-term care for children with special needs through special needs trusts, ABLE accounts, and government benefits.