Key takeaways:

  • Equity returns over the last ten years have bolstered the performance of balanced portfolios. 
  • The outperformance of growth stocks relative to the rest of the market means many portfolios may by overexposed to risk.

January 08, 2025 – Many investors’ portfolios have delivered impressive returns in recent years. The traditional balanced portfolio of 60% equities (represented by the S&P 500® Index) and 40% bonds (represented by the Bloomberg US Aggregate Bond Index) achieved an above average annualized return of 9% over the past decade. The equity side of this allocation has had the biggest impact, with the S&P 500 averaging a 13% annualized return over this time. In contrast, the benchmark bond index has managed just a 1% average annualized gain.

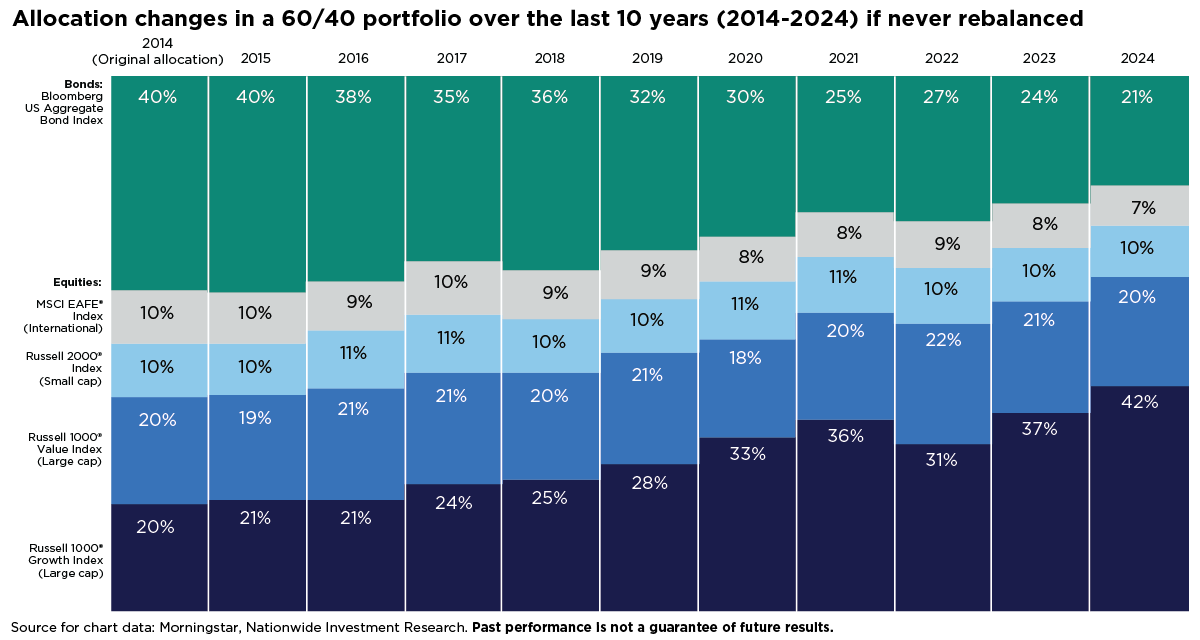
Over this 10-year span, the forward valuation of the S&P 500 has jumped by nearly one-third, from 16 times to 21 times, while the yield on the 10-year U.S. Treasury rose from 2.19% to 4.57%. As a result, a portfolio that was not rebalanced during that period would have gone from a 60%/40% allocation to 79%/21%. Since 1980, the bond market has outperformed the equity market just over one-fourth of the time, or 12 of the past 45 years, but since the Global Financial stocks outperformed bonds in 13 of the 16 years.

Below the surface, the shifts are even more pronounced. Large-cap growth equities have dominated stock index returns. Over the last ten years (2014-2024), the Russell 1000® Growth Index (representing the 1000 biggest growth-oriented companies) has averaged a 17% annualized return, more than double the pace of the Russell 1000® Value Index (8%), the small-cap Russell 2000® Index (8%), and the international-stock benchmark MSCI EAFE® Index (5%).

A graph illustrating allocation changes in a 60/40 portfolio over the last ten years (2014 – 2024) if never rebalanced.

The accompanying chart shows how a hypothetical allocation to these different slices of the equity market would have changed a 60/40 balanced portfolio over the last 10 years. If an investor left this portfolio untouched and never rebalanced during this time, the allocation to growth equities would have more than doubled from 20% to 42%. Value and small caps would be unchanged at 20% and 10%, respectively, and international and bonds would have shrunk substantially.

Interestingly, the last time an imbalance of this magnitude occurred was during the dot-com stock bubble of the late 1990s. Following that period (beginning in 2000), the bond market outperformed stocks for three consecutive years, value outperformed growth in seven straight years, small caps outperformed large caps in six of seven, and international stocks bested U.S. domestic equities each year from 2003 to 2008.

With many growth stocks at sky-high valuations, there’s a significant risk of a downturn in this part of the market. Investors who have slept on rebalancing their portfolios during the bull market for growth stocks may be exposed to more risk than they’re comfortable with. That’s why diversification and rebalancing are so important to a long-term investment plan.

Author(s)

Mark Hackett, CFA, CMT

Chief Market Strategist, Nationwide Investment Management Group

Mark Hackett is the Chief Market Strategist for Nationwide’s Investment Management Group, bringing more than 20 years of experience in the asset management industry to the role.

Trending articles

In the coming years, more people will begin to think about the costs of health care in retirement and the possibility of needing long-term care (LTC) in the future, especially as the number of Americans reaching age 65 hits an all-time high this year.

Considerations for financial professionals on supporting retirees through economic uncertainty.

This guide explores strategies for securing long-term care for children with special needs through special needs trusts, ABLE accounts, and government benefits.

Disclaimers

This material is not a recommendation to buy or sell a financial product or to adopt an investment strategy. Investors should discuss their specific situation with their financial professional.

Except where otherwise indicated, the views and opinions expressed are those of Nationwide as of the date noted, are subject to change at any time and may not come to pass.

Russell 1000 Growth® Index: An unmanaged index that measures the performance of the large-capitalization growth segment of the U.S. equity universe; includes those Russell 1000® Index companies with higher price-to-book ratios and higher forecasted growth values.

Russell 1000® Value Index: An unmanaged index that measures the performance of the large-capitalization value segment of the U.S. equity universe; includes those Russell 1000® Index companies with lower price-to-book ratios and lower forecasted growth values.

Russell 2000® Index: An unmanaged index that measures the performance of the small-capitalization segment of the U.S. equity universe.

Russell Investment Group is the source and owner of the trademarks, service marks and copyrights related to the Russell Indexes. The Fund is not sponsored, endorsed, or promoted by Russell, and Russell bears no liability with respect to any such funds or securities or any index on which such funds or securities are based. Russell® is a trademark of Russell Investment Group.

S&P 500® Index: An unmanaged, market capitalization-weighted index of 500 stocks of leading large-cap U.S. companies in leading industries; it gives a broad look at the U.S. equities market and those companies’ stock price performance.

S&P Indexes are trademarks of Standard & Poor’s and have been licensed for use by Nationwide Fund Advisors. The Products are not sponsored, endorsed, sold or promoted by Standard & Poor’s and Standard & Poor’s does not make any representation regarding the advisability of investing in the Product.

Bloomberg US Aggregate Bond Index: An unmanaged, market value-weighted index of U.S. dollar-denominated, investment-grade, fixed-rate, taxable debt issues, which includes Treasuries, government-related and corporate securities, mortgage- backed securities (agency fixed-rate and hybrid adjustable-rate mortgage pass-throughs), asset-backed securities and commercial mortgage-backed securities (agency and non-agency).

Bloomberg® and its indexes are service marks of Bloomberg Finance L.P. and its affiliates including Bloomberg Index Services Limited, the administrator of the index, and have been licensed for use for certain purposes by Nationwide. Bloomberg is not affiliated with Nationwide, and Bloomberg does not approve, endorse, review or recommend this product. Bloomberg does not guarantee the timeliness, accurateness, or completeness of any date or information relating to this product.

MSCI EAFE® Index: An unmanaged, free float-adjusted, market capitalization-weighted index that is designed to measure the performance of large-cap and mid-cap stocks in developed markets as determined by MSCI; excludes the United States and Canada.

The Fund is not sponsored, endorsed, or promoted by MSCI, and MSCI bears no liability with respect to any such funds or securities or any index on which such funds or securities are based.