Key takeaways:

  • The durability of the current rotation in market leadership rotation largely depends on the trajectory of earnings growth during the upcoming reporting season and beyond.
  • Investors have to discern between rotations driven by earnings growth and those driven by optimism, such as higher business sentiment measures.

January 29, 2025 – Over the past few weeks, several key themes have captured investors' attention, including the rapid rise and subsequent fall of interest rates, renewed investor confidence, and shifts among equity sectors. We can note the potential improvement in market breadth. For example, on Monday, January 27, despite the S&P 500® Index declining by nearly 1.5%, over 300 of its constituent stocks posted gains, underscoring healthy market breadth beneath the Index level.


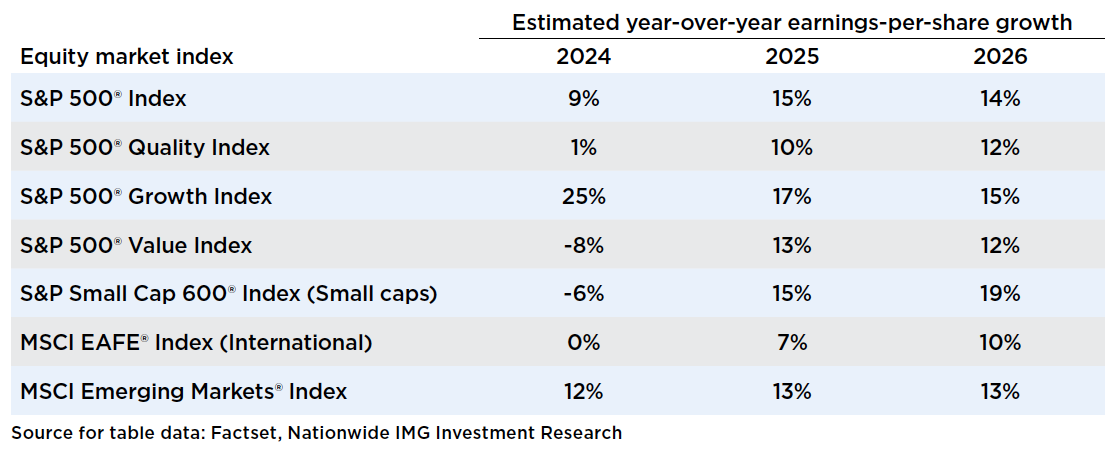
A graph illustrating the estimated year-over-year earnings-per-share growth

The rapid shift in expectations over the past month highlights the increased volatility investors face in the changing landscape of economic data, fiscal policy, interest rates, and the Federal Reserve's responses. The main issue for investors to focus on is understanding the sustainability of the market leadership rotation happening beneath the Index level. This rotation largely depends on the path of relative earnings growth during the reporting season and beyond.

In this uncertain environment, investors need to distinguish between rotations driven by solid evidence, like relative earnings growth, and those driven by increased optimism, such as higher business sentiment measures. The accompanying table shows the current consensus expectations for various indices, highlighting high hopes for broader earnings growth, especially for value, international, and small-cap stocks.

However, as investors have learned over the past few years, consensus expectations don't always come true. For example, at the start of 2024, there were high hopes for small caps, with expected earnings-per-share (EPS) growth of 10% for the S&P SmallCap 600® Index. Instead, the Index ended 2024 with a year-over-year earnings decline of about 6%. Rising interest rates and a more hawkish Federal Reserve repeatedly delayed the earnings recovery, continuing to pressure small-cap stocks.

While it's encouraging to see higher expectations for earnings growth in 2025, investors should keep an eye on EPS revisions throughout the year. As the past few years have shown, just because the consensus expects something doesn't mean it will actually happen.

Author(s)

Mark Hackett, CFA, CMT

Chief Market Strategist, Nationwide Investment Management Group

Mark Hackett is the Chief Market Strategist for Nationwide’s Investment Management Group, bringing more than 20 years of experience in the asset management industry to the role.

Trending articles

In the coming years, more people will begin to think about the costs of health care in retirement and the possibility of needing long-term care (LTC) in the future, especially as the number of Americans reaching age 65 hits an all-time high this year.

Considerations for financial professionals on supporting retirees through economic uncertainty.

This guide explores strategies for securing long-term care for children with special needs through special needs trusts, ABLE accounts, and government benefits.

Disclaimers

This material is not a recommendation to buy or sell a financial product or to adopt an investment strategy. Investors should discuss their specific situation with their financial professional.

Except where otherwise indicated, the views and opinions expressed are those of Nationwide as of the date noted, are subject to change at any time and may not come to pass.

MSCI EAFE® Index: An unmanaged, free float-adjusted, market capitalization-weighted index that is designed to measure the performance of large-cap and mid-cap stocks in developed markets as determined by MSCI; excludes the United States and Canada.

MSCI Emerging Markets® Index: An unmanaged, free float-adjusted, market capitalization-weighted index that is designed to measure the performance of large-cap and mid-cap stocks in emerging-country markets as determined by MSCI.

The Fund is not sponsored, endorsed, or promoted by MSCI, and MSCI bears no liability with respect to any such funds or securities or any index on which such funds or securities are based.

S&P 500® Index: An unmanaged, market capitalization-weighted index of 500 stocks of leading large-cap U.S. companies in leading industries; it gives a broad look at the U.S. equities market and those companies’ stock price performance.

S&P SmallCap 600® Index (S&P 600): a stock market index established by Standard & Poor's that covers roughly the small-cap range of American stocks, using a capitalization-weighted index.

S&P 500® Quality Index: A stock index that tracks the performance of the highest quality stocks in the S&P 500. It's based on a quality score that considers a company's return on equity, accruals ratio, and financial leverage ratio.

S&P 500® Growth Index: An index consisting of those stocks in the S&P 500 Index exhibiting the strongest growth characteristics based on: (i) sales growth; (ii) earnings change to price; and (iii) momentum.

S&P 500® Value Index: A style-concentrated index designed to track the performance of the S&P 500 stocks that exhibit the strongest value characteristics by using a style attractiveness weighting scheme.

S&P Indexes are trademarks of Standard & Poor’s and have been licensed for use by Nationwide Fund Advisors. The Products are not sponsored, endorsed, sold or promoted by Standard & Poor’s and Standard & Poor’s does not make any representation regarding the advisability of investing in the Product.