Key takeaways:

  • Stock markets are fluctuating under the strain of uncertainty around economic growth and the potential for a recession.
  • Volatility and drawdowns are not anomalies in the market; they are instead common and highlight the importance of a long-term investment horizon.

03/12/2025 – A growing murmur among investors suggests that U.S. economic growth may be faltering. Occasionally, you can even hear a faint but persistent mention of the dreaded "recession" word.

Most notably in the last week, the Atlanta Fed’s Real GDP "Nowcast" on March 3 projected an estimated negative annualized growth rate for Q1 of -2.8%. One negative quarter does not make a recession (the official definition is two consecutive quarters of negative annualized GDP growth), but this is a precipitous decline from the sanguine growth rate of 4% just a few weeks ago.

Other disappointing data releases in the past few weeks underscore a potential loss of economic momentum: weakness in services Purchasing Managers Index (PMI), tepid retail sales, and slumps in the housing market. Additionally, there are concerns that analysts may reduce S&P 500® Index earnings-per-share estimates because of tariffs and trade issues.

While not guaranteed, it’s becoming more likely that the U.S. economy may experience a soft patch in the first half of this year. Equity markets—ever the barometer of investor sentiment—continue to fluctuate under the strain of this uncertainty. The CNN Fear & Greed Index captures these emotional swings; it shifted to "extreme fear" over the last two weeks. The American Association of Individual Investors’ weekly survey also shows continued bearish sentiment.

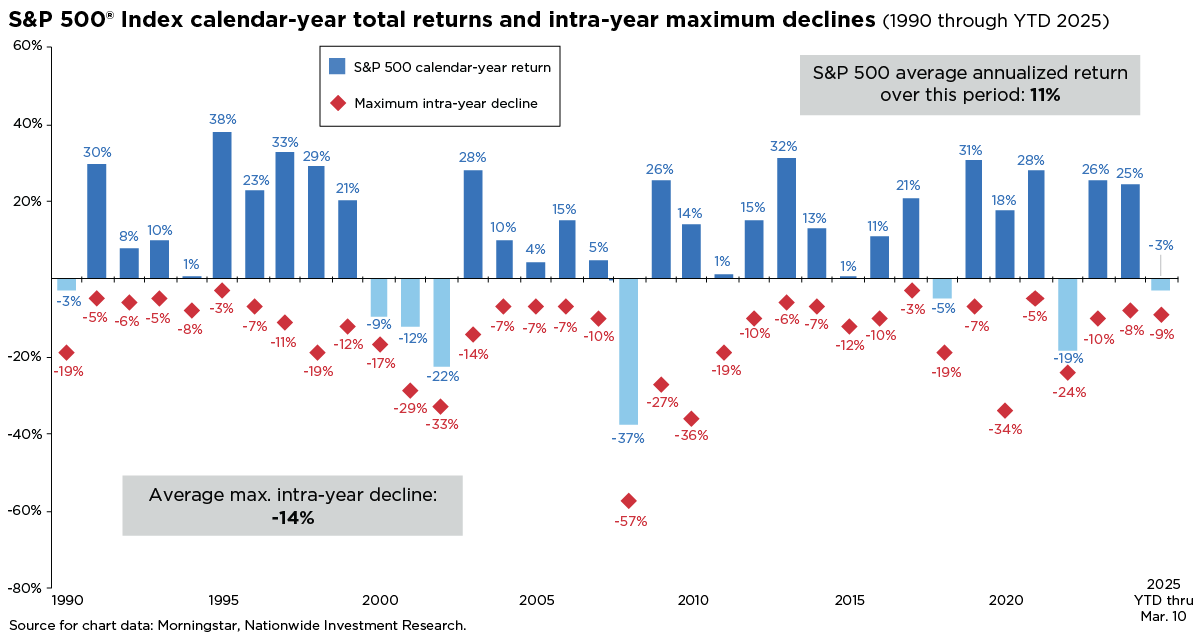
a chart showing the S&P 500® Index calendar-year total returns and intra-year maximum declines from 1990 to YTD 2025, over which the average annualized return was 11% and the average maximum intra-year decline was -14%

Daily price movements in the stock market reflect this uncertainty as investors react to headlines about tariffs. For instance, after the S&P 500 declined by 1.8% on March 6, the index moved over 1% in either direction for six consecutive days—the longest such streak since November 2020. Beneath the index level, however, a shift in sector leadership continues to unfold as investors reassess the financial landscape.

Despite the recent modest pullback, history offers a steadying perspective for investors. Volatility, uncertainty, and periods of decline are not anomalies or reasons for panic. Instead, investors should remember that intra-year drawdowns are common and underscore the importance of maintaining a long-term horizon.

As the accompanying chart shows, there have been stock market retreats every year since 1990, with the average decline being 14%. Remarkably, in the years when the S&P 500 experienced a double-digit decline, the market ended the year with a positive return 64% of the time, or 13 out of 20 instances.

Market drawdowns, though jarring when they occur, are par for the course in investing. Recent volatility and bearish sentiment surrounding trade and economic growth may unsettle investors, but history shows that uncertainty often breeds opportunity for those with a financial plan and long-term outlook.

Author(s)

Mark Hackett, CFA, CMT

Chief Market Strategist, Nationwide Investment Management Group

Mark Hackett is the Chief Market Strategist for Nationwide’s Investment Management Group, bringing more than 20 years of experience in the asset management industry to the role.

Trending articles

In the coming years, more people will begin to think about the costs of health care in retirement and the possibility of needing long-term care (LTC) in the future, especially as the number of Americans reaching age 65 hits an all-time high this year.

Considerations for financial professionals on supporting retirees through economic uncertainty.

This guide explores strategies for securing long-term care for children with special needs through special needs trusts, ABLE accounts, and government benefits.
Disclaimers

This material is not a recommendation to buy or sell a financial product or to adopt an investment strategy. Investors should discuss their specific situation with their financial professional.

Except where otherwise indicated, the views and opinions expressed are those of Nationwide as of the date noted, are subject to change at any time and may not come to pass.

Purchasing Managers Index: A monthly survey-based economic indicator that measures the health of the manufacturing and services sectors.

S&P 500® Index: An unmanaged, market capitalization-weighted index of 500 stocks of leading large-cap U.S. companies in leading industries; it gives a broad look at the U.S. equities market and those companies’ stock price performance.

CNN Fear & Greed Index: A compilation of seven different indicators that measure some aspect of stock market behavior. They are market momentum, stock price strength, stock price breadth, put and call options, junk bond demand, market volatility, and safe haven demand.

S&P Indexes are trademarks of Standard & Poor’s and have been licensed for use by Nationwide Fund Advisors. The Products are not sponsored, endorsed, sold or promoted by Standard & Poor’s and Standard & Poor’s does not make any representation regarding the advisability of investing in the Product.