07/24/2024 — Much has been made about the top-heavy nature of this year’s stock market rally. The “Magnificent 7” stocks contributed more than half of the S&P 500® Index’s first-half returns. One Mag-7 stock, NVIDIA, accounted for nearly one-third of the benchmark’s year-to-date return.

The extended rally has pushed the price-to-earnings of the Russell 1000® Growth Index (representing the largest U.S. growth stocks) to more than 30 times the next 12 months’ earnings. That’s roughly double the current forward P/E of the Russell 1000® Value Index, Russell 2000® Index, MSCI EAFE® Index, or the MSCI Emerging Markets® Index. For some time, investors have expected this top-heavy trend to reverse. Still, any spell of small-cap, value, or international outperformance has petered out as investors use the relative weakness of technology stocks as a buying opportunity.

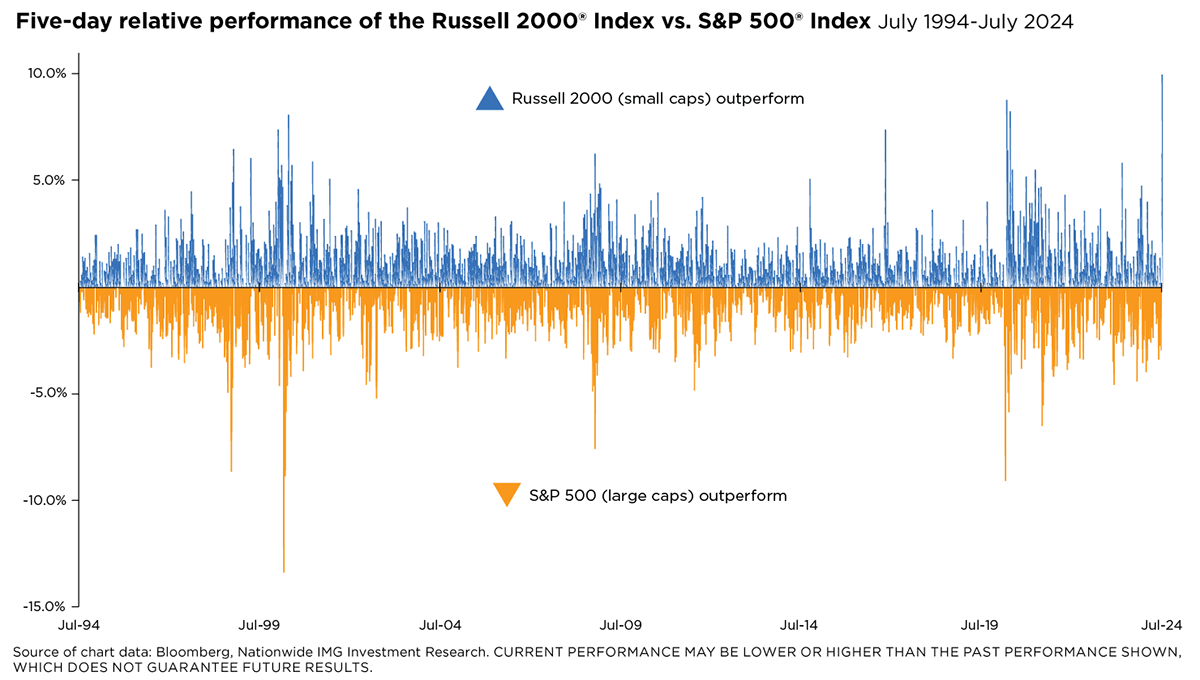
When market trends shift, they often do so dramatically. Over the last two weeks, stock market performance has favored small caps. The Russell 2000 Index of small-company stocks recently went on a torrid five-day run of daily gains of over 1%. That has happened only five other times in the Russell 2000’s history, dating back to 1979. Moreover, on July 16, 2024, the Russell 2000 Index closed at an astonishing 4.4 standard deviations above its 50-day moving average, highlighting how extraordinary this run of small-company outperformance has been.

Five-day relative performance of the Russell 2000 index vs. S&P 500 Index (July 1994-July 2024).

Watching short-term performance trends is interesting, but the more critical question is what will happen over the longer term. According to data from renowned financial professor Kenneth French, dating back to 1930, the average small-cap stock has outperformed the average large-cap stock in seven of the last nine decades going back to 1930. The 1980s and the 2010s were the only exceptions. If the current decade ended today, it would be the third exception to this long-term trend.

The current performance and valuation gap is reminiscent of the tech and dot-com stock bubble era of the late 1990s and early 2000s. Once the bubble for large caps burst, the Russell 2000 Index outperformed the Russell 1000 Growth by 79% between August 2000 and June 2006.

For small caps to continue rallying, interest rates will need to come down, more firms will have to beat analyst earnings estimates by wider margins, and the economy will need to avoid a slowdown. You may remember the strong rally for small caps in Q4 of 2023, which was predicated on lower interest rates. That rally stalled when rates didn’t trend lower. If interest rates remain elevated or economic growth deteriorates, the rally in small caps will likely reverse.

Author(s)

Mark Hackett, CFA, CMT

Chief of Investment Research, Nationwide Investment Management Group

Mark Hackett is the Chief of Investment Research for Nationwide’s Investment Management Group, bringing more than 20 years of experience in the asset management industry to the role.

Trending articles

In the coming years, more people will begin to think about the costs of health care in retirement and the possibility of needing long-term care (LTC) in the future, especially as the number of Americans reaching age 65 hits an all-time high this year.

Considerations for financial professionals on supporting retirees through economic uncertainty.

The Windfall Elimination Provision (WEP) is critical for financial professionals to understand.

Disclosure statement:

Except where otherwise indicated, the views and opinions expressed are those of Nationwide as of the date noted, are subject to change at any time and may not come to pass.

Russell 1000 Growth® Index: An unmanaged index that measures the performance of the large-capitalization growth segment of the U.S. equity universe; includes those Russell 1000® Index companies with higher price-to-book ratios and higher forecasted growth values.

Russell 1000® Value Index: An unmanaged index that measures the performance of the large-capitalization value segment of the U.S. equity universe; includes those Russell 1000® Index companies with lower price-to-book ratios and lower forecasted growth values.

Russell 2000® Index: An unmanaged index that measures the performance of the small-capitalization segment of the U.S. equity universe.

Russell Investment Group is the source and owner of the trademarks, service marks and copyrights related to the Russell Indexes. The Fund is not sponsored, endorsed, or promoted by Russell, and Russell bears no liability with respect to any such funds or securities or any index on which such funds or securities are based. Russell ® is a trademark of Russell Investment Group.

S&P 500® Index: An unmanaged, market capitalization-weighted index of 500 stocks of leading large-cap U.S. companies in leading industries; gives a broad look at the U.S. equities market and those companies’ stock price performance.

S&P Indexes are trademarks of Standard & Poor’s and have been licensed for use by Nationwide Fund Advisors.  The Products are not sponsored, endorsed, sold or promoted by Standard & Poor’s and Standard & Poor’s does not make any representation regarding the advisability of investing in the Product.

MSCI Emerging Markets® Index: An unmanaged, free float-adjusted, market capitalization-weighted index that is designed to measure the performance of large-cap and mid-cap stocks in emerging-country markets as determined by MSCI.

MSCI EAFE® Index: An unmanaged, free float-adjusted, market capitalization-weighted index that is designed to measure the performance of large-cap and mid-cap stocks in developed markets as determined by MSCI; excludes the United States and Canada.

The Fund is not sponsored, endorsed, or promoted by MSCI, and MSCI bears no liability with respect to any such funds or securities or any index on which such funds or securities are based.