Still charging ahead: What the bull
market’s third year means for advisors
Key takeaways:
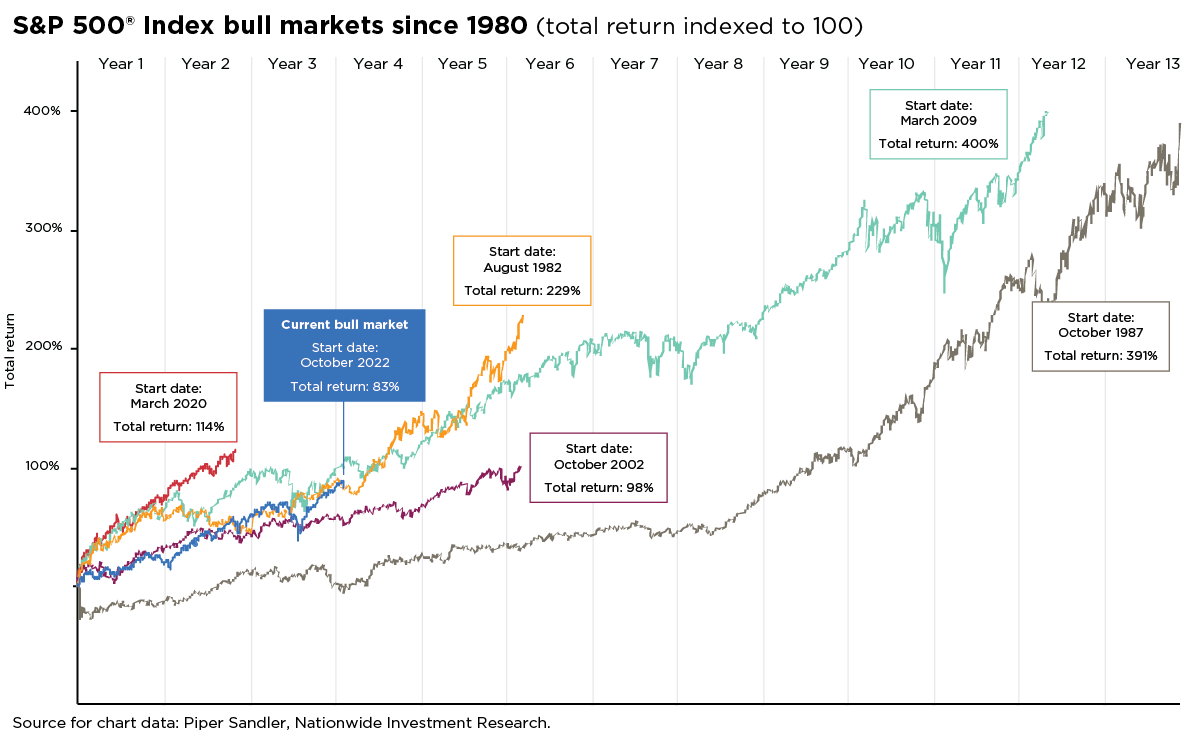
- Stocks have returned approximately 83% since the current bull market began—marking the second-strongest start in market history.
- Historical patterns suggest this bull market’s momentum may continue, offering advisors a potential runway for client portfolios.
10/22/2025 – On October 12, the bull market celebrated its third anniversary—not quietly, but with a commanding 16% gain over the past year. That’s the strongest third-year performance of any bull market in the past 75 years.
But this rally isn’t just about the numbers—it’s a story of resilience. From the start, equity investors have navigated a gauntlet: an earnings recession, decades-high inflation, one of the fastest Fed rate-hiking cycles since the 1980s, rolling recessions in parts of the economy, inverted yield curves, multiple market corrections, and the outsized influence of the “Mag 7” tech giants. Add in this year’s tariff-related uncertainty, and the market’s climb looks more improbable.
Still, the market pressed on—unshaken by bearish sentiment and a patchwork economic cycle. Over the past three years, the S&P 500® Index delivered a cumulative return of roughly 83%, marking the second-strongest start to a bull market in history. And while valuation expansion played a role—accounting for about 52% of the gain through October 10—it wasn’t the total story. Earnings growth contributed nearly one-third of the overall return, underscoring the fundamental strength behind the rally.
Whether this momentum holds will depend on the strength of underlying fundamentals—a theme we’ve explored often. Historically, the setup suggests room to run. At just three years old, this bull market is still younger than the post-1950 average of 5½ years. And its 83% cumulative return still falls well short of the typical bull-market gain of roughly 190%. (See accompanying chart.)
Even more encouraging: momentum heading into Q4 has been hard to ignore. September delivered the strongest performance in 15 years—remarkable for a month that’s historically tough on equities. The S&P 500 also notched 23 new all-time highs in Q3, tying Q4 2017 as the second-best quarter for record highs since 1998.
Technical tailwinds point to investors leaning into market strength, with retail equity purchases hitting record levels. Fundamentals reinforce that momentum: economic growth remains solid, with the Atlanta Fed’s GDPNow model projecting Q3 real GDP at 3.9%—roughly in line with Q2. Meanwhile, the Fed appears poised to continue easing monetary policy through year-end, aiming to soften financial conditions and cushion any emerging labor market weakness.
Corporate earnings continue to show resilience. Q2 marked the third consecutive quarter of double-digit year-over-year growth for the S&P 500—a powerful signal amid broader economic uncertainty. Early indicators suggest the Q3 earnings season may extend that momentum.
Looking ahead, structural tailwinds could help carry this rally well into 2026. Increased investment in AI, deregulation, fiscal policy incentives—including 100% bonus depreciation, laying the foundation for stronger productivity and more durable earnings growth.
Taken together, these forces suggest the runway for equities may be longer than many skeptics expect. This bull market continues to reinforce a timeless principle: staying invested with a long-term lens—free from emotional decision-making—is still the cornerstone of sound investing.
Timely insights at your fingertips
Author(s)

Mark Hackett, CFA®, CMT®, CFP®
Chief Market Strategist, Nationwide Investment Management Group
Mark Hackett is the Chief Market Strategist for Nationwide’s Investment Management Group, bringing more than 20 years of experience in the asset management industry to the role.
Trending articles
In the coming years, more people will begin to think about the costs of health care in retirement and the possibility of needing long-term care (LTC) in the future, especially as the number of Americans reaching age 65 hits an all-time high this year.
Considerations for financial professionals on supporting retirees through economic uncertainty.
This guide explores strategies for securing long-term care for children with special needs through special needs trusts, ABLE accounts, and government benefits.