08/07/2024 — Equity markets were unusually calm in the first half of 2024, but that has changed abruptly over the last several weeks. The volatility on Monday, August 5, made headlines, with the S&P 500® Index falling 3.0% on the day (the worst day for the U.S. stock market benchmark since September 2022), but much of the turbulence has been brewing since last month.
Stock markets began to waver around July 10, with no specific catalyst for the volatility. Any volatility we had experienced over the last year was usually sparked by changing expectations for interest rate moves. But more recently, investor sentiment began a swift and decisive turn away from large-cap technology stocks—especially the “Magnificent 7” stocks—and toward other cyclically-sensitive parts of the market, such as industrials and materials.
From the July 10 peak to month-end, the Mag-7 stocks fell about 10% collectively, while the S&P 500 declined closer to 3.5% overall. In contrast, the S&P 500® Equal Weight Index increased nearly 3.5% over time. (With the S&P 500, the largest stocks by market capitalization can have an outsized influence on the index’s overall performance. The equal-weight index can give a different picture of stock market participation.)
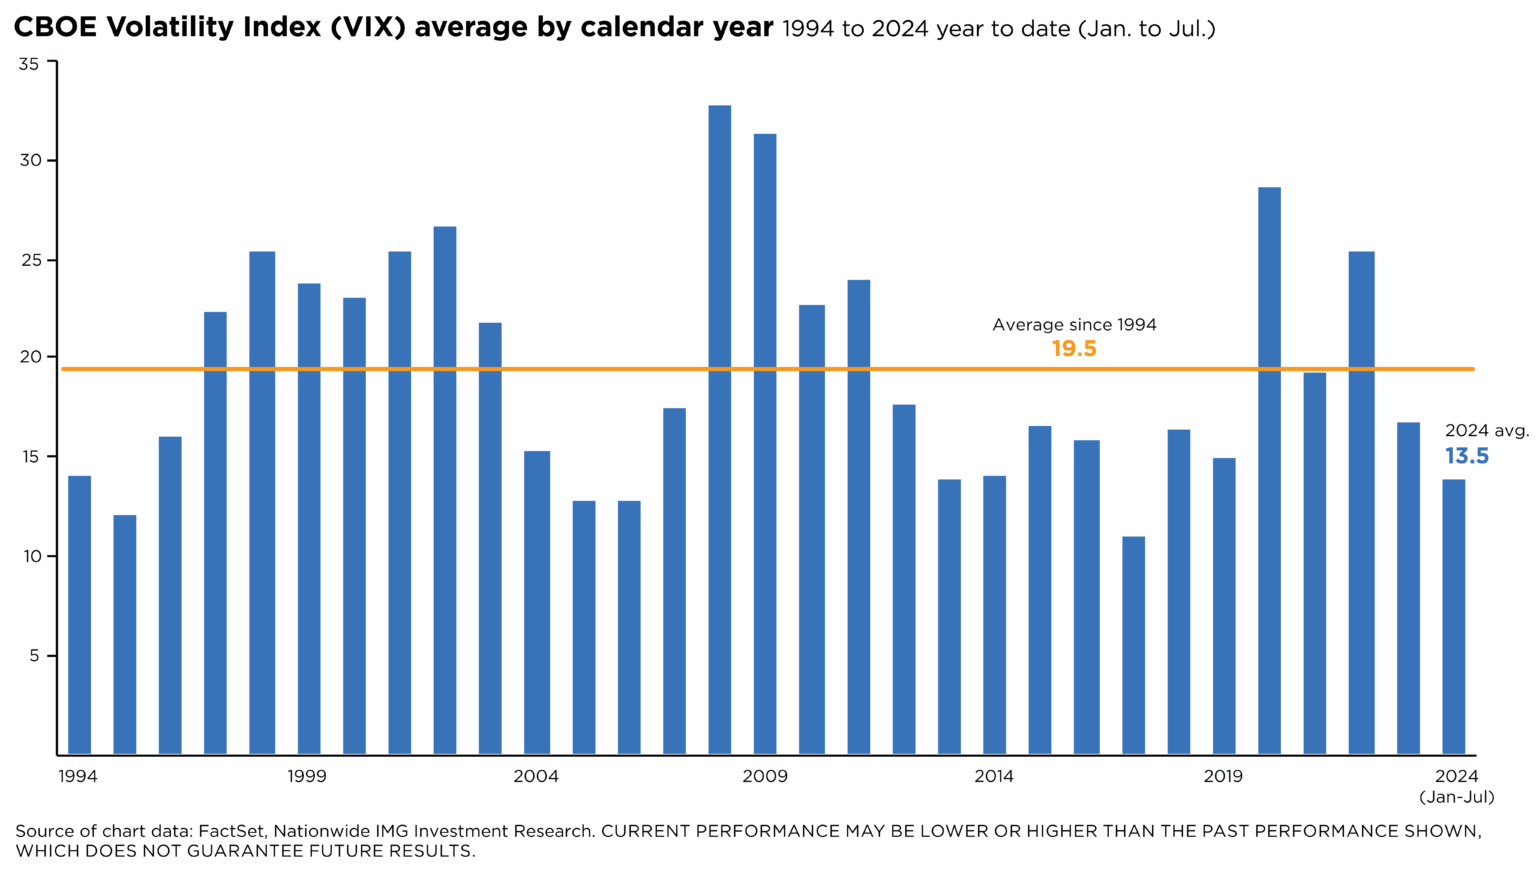
In other words, stock volatility returned unexpectedly with the rotation toward different parts of the market. The rise in volatility is best seen in the CBOE Volatility Index (VIX), which measures stock investors’ expectations of market volatility. VIX spiked from a benign 12.8 on July 10 to an intraday high of 19.4 on July 31, closing the trading day at around 16.3.

As U.S. stock markets opened on August 5, the VIX spiked to an intraday high of 65. This was the highest level for the volatility index since the early days of the pandemic, as signs of a slowing economy and a rapid unloading of “carry trades” spread fear among market participants. Ultimately, the VIX ended the day at 38, ranking in the 96th percentile of daily closing values for the volatility index since 1999.
The calm among stock investors earlier this year was pleasant while it lasted. Still, the latest surge in volatility serves as a reminder of the fleeting and unpredictable nature of the market. As the accompanying chart illustrates, 2024 had been shaping up to be one of the calmest years for stocks; for the year to date through July, the VIX average was well below its 30-year average and at its lowest level since 2017. This occurred despite different economic signals that typically spark volatility, including a declining Leading Economic Index, contraction in the ISM Manufacturing Index, and a yield curve that’s been inverted for more than two years.
Regularly reviewing clients’ retirement accounts and holdings can help identify opportunities for NUA, as well as educating them about the potential tax benefits and considerations of NUA.
Working with tax professionals can help to ensure the optimal execution of NUA strategies. By integrating NUA strategies into your practice, you have the opportunity to enhance your clients’ retirement outcomes and provide sophisticated tax planning advice.


