Will technicals drive stocks higher
in the second half of the year?
Key takeaways:
- The next phase of the stock market rally may be driven less by price momentum and more by consolidation and improving fundamentals.
- In the second half of 2025, investors should brace for volatility and mixed signals from economic data, with elevated valuations potentially amplifying market reactions.
07/23/2025 – After a powerful rally, such as the S&P 500® Index’s 26% surge off its April lows, investors often find themselves caught between fervent momentum and cautious optimism. Strength in technical indicators (e.g., improving market breadth) has underpinned this rally, yet beneath the surface investor positioning and sentiment tell a more nuanced story. These barometers suggest that the next phase in this run may be less about price momentum and more about consolidation and improving fundamentals.
On the one hand, investor positioning remains neutral. Many measures of equity exposure are still well below historical averages, pointing to a lack of investor exuberance. For example, the Deutsche Bank Consolidated Equity Positioning Index only recently returned to neutral after recovering from the April volatility shock—even as this rally ranks as the fourth strongest in the first 65 trading days (through July 14, 2025) following a major market low.
Similarly, Bank of America’s Global Fund Manager Survey shows professional investors are only 2% overweight equities—about 0.8 standard deviations below the long-term average. That’s a sharp contrast from late 2024, when equity overweights were near 100% and the Deutsche Bank index was hovering around all-time highs. This underexposure isn’t just a technical detail—it reflects a broader reluctance to fully embrace the rally, even as the S&P 500 notches new records.
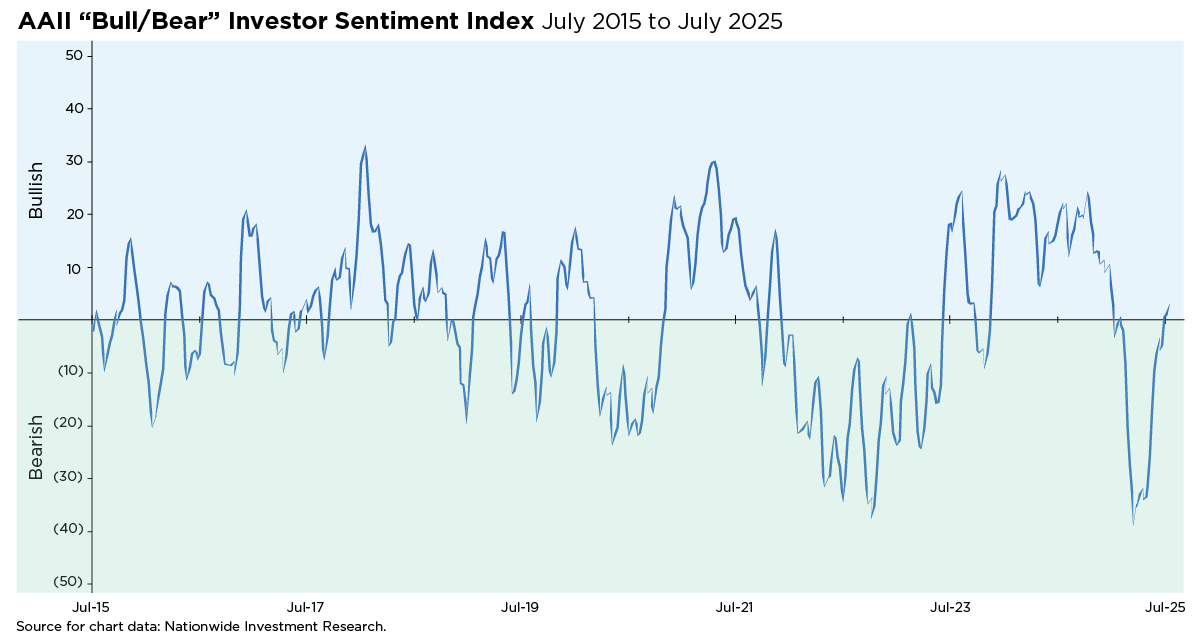
On the other hand, several sentiment indicators are leaning bullish—some even showing early signs of exuberance. CNN’s Fear & Greed Index recently surged into “extreme greed” territory, its highest level since early July, but has since ticked back to "greed." While the AAII Bull-Bear Spread saw a slight pullback last week, it posted consecutive positive readings for the weeks of July 2 and July 9—the first streak of its kind since January—hinting at a gradual recovery in investor optimism since the April lows. (See the accompanying chart.) Meanwhile, Goldman Sachs’ Retail Sentiment Basket has climbed past its 2021 peak, and the NAAIM Exposure Index has rebounded sharply from 35 on April 16 to 83 as of July 16.
But history offers a cautionary tale. After periods of deep pessimism and broad market strength—when many stocks rally together—investors often view the first wave of optimism with a critical eye. These early bursts of bullish sentiment are often reflexive, fueled by short covering and Fear of Missing Out (FOMO), rather than a lasting shift in conviction. That skepticism is clear in the continued underallocation to equities by institutional investors, who remain cautious about the rally’s staying power.
All told, as the market begins to digest Q2 earnings in search of resilient corporate fundamentals, positioning and sentiment suggest the “pain trade”—the move that catches most investors off guard—could be to the upside. Still, the second half of 2025 may bring pockets of volatility, especially as economic data sends mixed signals. With the S&P 500 now trading at 22 times forward earnings, elevated valuations could amplify the market’s response.
Author(s)

Mark Hackett, CFA®, CMT®, CFP®
Chief Market Strategist, Nationwide Investment Management Group
Mark Hackett is the Chief Market Strategist for Nationwide’s Investment Management Group, bringing more than 20 years of experience in the asset management industry to the role.
Trending articles
In the coming years, more people will begin to think about the costs of health care in retirement and the possibility of needing long-term care (LTC) in the future, especially as the number of Americans reaching age 65 hits an all-time high this year.
Considerations for financial professionals on supporting retirees through economic uncertainty.
This guide explores strategies for securing long-term care for children with special needs through special needs trusts, ABLE accounts, and government benefits.