After climbing a wall of worry,
how will stocks finish 2025?
Key takeaways:
- Seasonal strength plays a key role. Historically, November and December have delivered solid returns—especially when markets enter year-end with strong momentum.
- Technical signals reinforce the trend. It’s not just seasonality; indicators point to continued strength as the bull market moves into its fourth year.
11/12/2025 – In 2025, investors have faced a familiar “wall of worry”—from uncertain tariff policies to negative sentiment and mixed economic signals. Despite these headwinds, the S&P 500® Index has climbed 17.5% through October, reminding advisors that markets can rally even when the backdrop looks challenging.
Volatility has remained brief and limited this year—a reassuring trend for advisors concerned about market swings. Still, client anxiety is rising: Nationwide’s annual Economic Impact Survey shows that 25% of consumers believe the market is overvalued, and nearly one-third expect managing volatility to be a top challenge in 2026. These perceptions highlight an opportunity for advisors to address risk and reinforce portfolio strategies.
Before the year closes, advisors still have two months of market activity to navigate. Historically, stocks tend to perform well in November and December, averaging gains of 1.9% and 1.4%, with positive returns nearly 70% of the time. November stands out as the strongest month on average since 1950, second-best over the past 20 years, and the top performer over the past decade—insights that can help frame client expectations as the year wraps up.
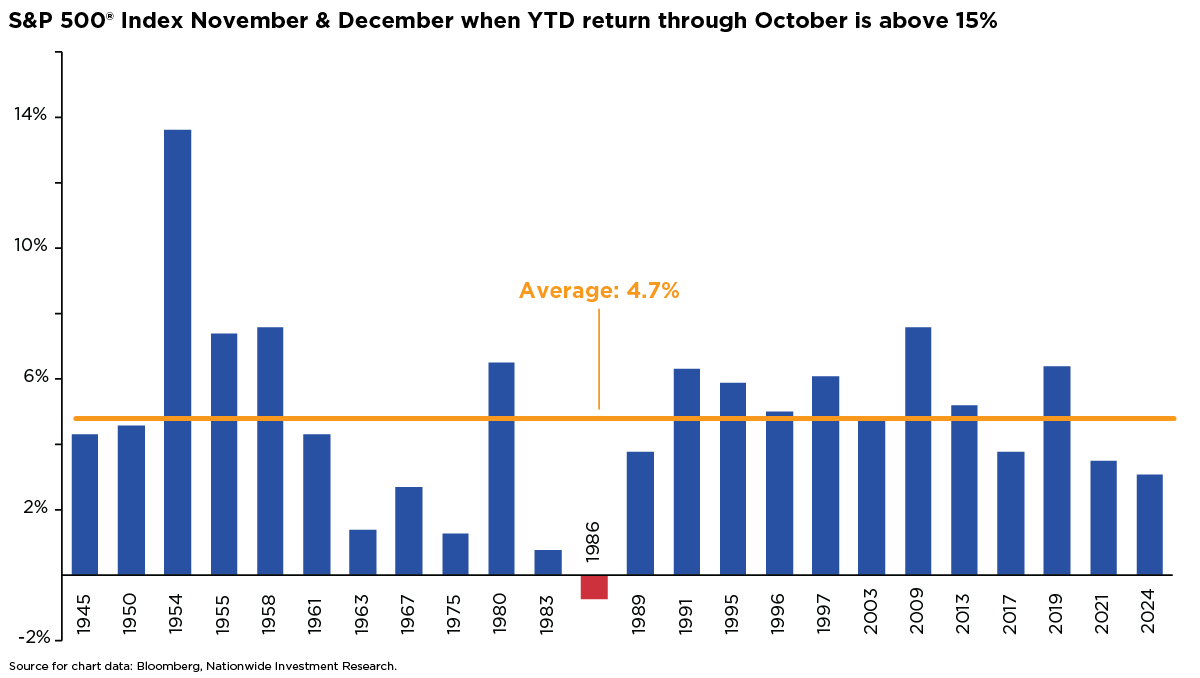
Historically, when the S&P 500 gains over 15% through October—as it has this year—the market tends to add another 4.7% on average before year-end (see chart). That momentum often carries into the final two months, creating a seasonal tailwind that supports a bullish outlook for 2025. For advisors, this trend can help frame client expectations around year-end positioning and reinforce confidence in staying invested.
This isn’t just about seasonal trends pushing markets higher into year-end—there are strong technical signals supporting this rally. The current bull market is entering its fourth year on the back of a powerful rebound: the S&P 500’s bounce from the April 8 low ranks as the sixth strongest on record. Historically, that kind of momentum often leads to gains over the next year, though short-term volatility is still likely.
As you prepare for year-end client conversations, expect some concerns that echo today’s cautious consumer sentiment. Remember, though, that caution often serves as a contrarian signal in markets. Several tailwinds could help equities keep climbing the “wall of worry” and limit any volatility to short-lived bouts. Among them: the Federal Reserve’s shift toward monetary easing, anticipated fiscal support in 2026, and continued strength in corporate earnings and margin expansion.
Author(s)

Mark Hackett, CFA®, CMT®, CFP®
Chief Market Strategist, Nationwide Investment Management Group
Mark Hackett is the Chief Market Strategist for Nationwide’s Investment Management Group, bringing more than 20 years of experience in the asset management industry to the role.
Trending articles
In the coming years, more people will begin to think about the costs of health care in retirement and the possibility of needing long-term care (LTC) in the future, especially as the number of Americans reaching age 65 hits an all-time high this year.
Considerations for financial professionals on supporting retirees through economic uncertainty.
This guide explores strategies for securing long-term care for children with special needs through special needs trusts, ABLE accounts, and government benefits.