How markets typically react to new Fed leadership
Key takeaways:
- Early-year technical signals lean constructive. Positive readings from the ‘First Five Days’ and ‘January Barometer’ support the durability of the bull market.
- A Fed leadership change introduces a key near-term risk. Markets often “test” new Fed chairs, making potential volatility a focus for client conversations.
02/11/2026 – January’s market gains added another data point supporting the view that this bull market has room to run through 2026—even if periods of volatility are likely along the way.
Market bulls point to two familiar seasonal indicators as further support: the ‘First Five Days’ rule and the ‘January Barometer,’ both of which flashed constructive signals to start 2026. The S&P 500® Index gained 1.1% over the first five trading days and finished January up 1.4%.
Historically, these indicators have carried meaningful weight. When the first five trading days finish positively, the S&P 500 has ended the year higher 81% of the time, with a median return of 14.2%. A positive January paints a similar picture: the Index has finished the year in positive territory 87% of the time, delivering an average gain of 12.2%.
Taken together, these early signals create a constructive backdrop as investors gauge the staying power of the market’s uptrend. But history has its limits. The rest of the year will hinge on several evolving—and currently unpredictable—transitions that could challenge the market’s momentum.
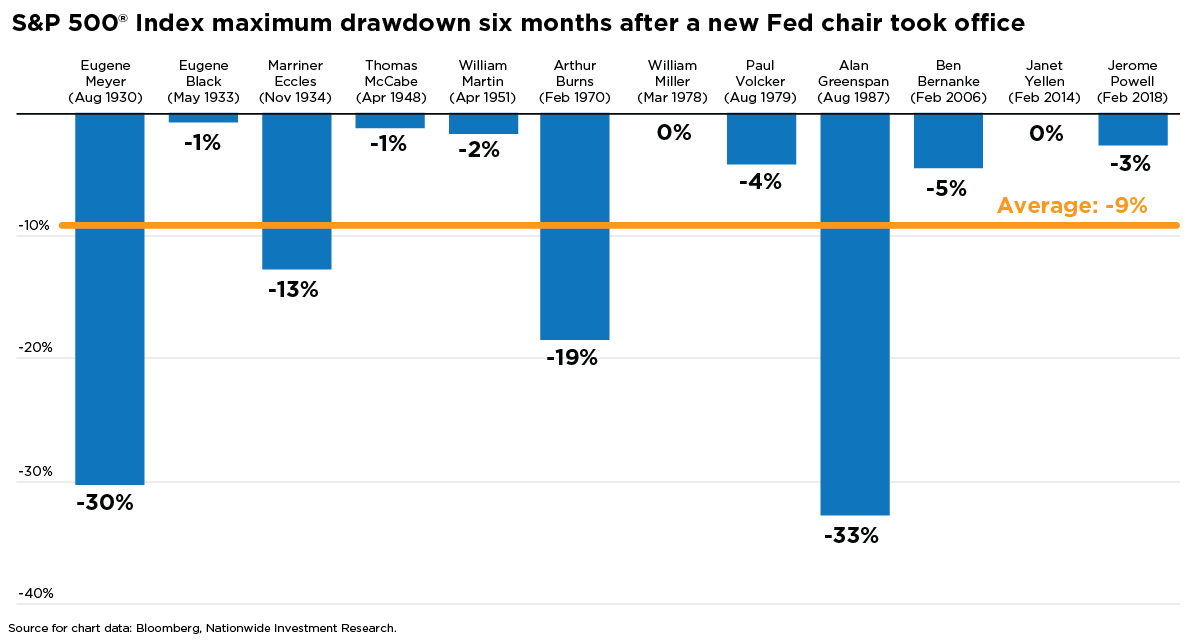
A key risk to the market’s momentum is the upcoming leadership change at the Federal Reserve, with Kevin Warsh expected to succeed Jerome Powell when Powell’s term ends in May. Historically, markets have tended to ‘test’ new Fed chairs, reflecting the uncertainty that often surrounds changes in policy tone, communication style, and the central bank’s decision-making approach.
This transition appears to be following a familiar pattern. As the accompanying chart highlights, in the six months after a new Fed chair is confirmed, the S&P 500 has historically experienced an average drawdown of about 9%. That pattern reflects how investors often reassess and recalibrate expectations under a new monetary regime.
Still, historical patterns should be viewed as context—not prophecy. The noise around a Fed transition can easily distract, but staying grounded in fundamentals, diversification, and long-term objectives remains the most effective guide. With crosscurrents likely ahead, advisors can help clients stay on track by managing risk thoughtfully, rebalancing when appropriate, and maintaining a disciplined long-term strategy.
Author(s)

Mark Hackett, CFA®, CMT®, CFP®
Chief Market Strategist, Nationwide Investment Management Group
Mark Hackett is the Chief Market Strategist for Nationwide’s Investment Management Group, bringing more than 20 years of experience in the asset management industry to the role.
Trending articles
In the coming years, more people will begin to think about the costs of health care in retirement and the possibility of needing long-term care (LTC) in the future, especially as the number of Americans reaching age 65 hits an all-time high this year.
Considerations for financial professionals on supporting retirees through economic uncertainty.
This guide explores strategies for securing long-term care for children with special needs through special needs trusts, ABLE accounts, and government benefits.