Should investors cheer or fear when markets hit all-time highs?
Key takeaways:
- Avoiding equities when markets are near all-time highs can carry a meaningful long-term cost.
- New highs don’t guarantee further gains or signal an imminent peak—but they highlight a wide range of potential outcomes.
06/03/2026 – The velocity of the stock market’s rebound from the late-March low has been nothing short of remarkable. The S&P 500® Index returned to an all-time high in just 11 trading days—marking the fastest recovery from a drawdown of at least 8% in 75 years. Over the 40 trading days from that low, the Index climbed nearly 18%, placing this rally among the strongest over a comparable period since the 1950s.
Beneath the surface, the strength of the move is even more striking. Some of the leading names in the AI complex—particularly semiconductor stocks—are trading over 100% above their 200-day moving averages. That kind of extension reflects not just strong fundamentals, but also the role of positioning and momentum in driving the rally.
Conviction has risen alongside the benchmark, with analysts steadily lifting their year-end targets for the S&P 500. That leaves investors weighing opportunity against discipline, grappling with whether to add exposure to elevated levels as the Index continues to climb toward new highs, even as leadership narrows and price action in key areas takes on a more momentum-driven, and potentially less sustainable, character. Avoiding equities simply because markets are at or near all-time highs can carry a meaningful long-term cost. Historical data reinforces this point: since 2013, the S&P 500 has recorded roughly 461 new highs, yet over that same period has delivered cumulative returns of over 400%—with average annual gains near 15%.
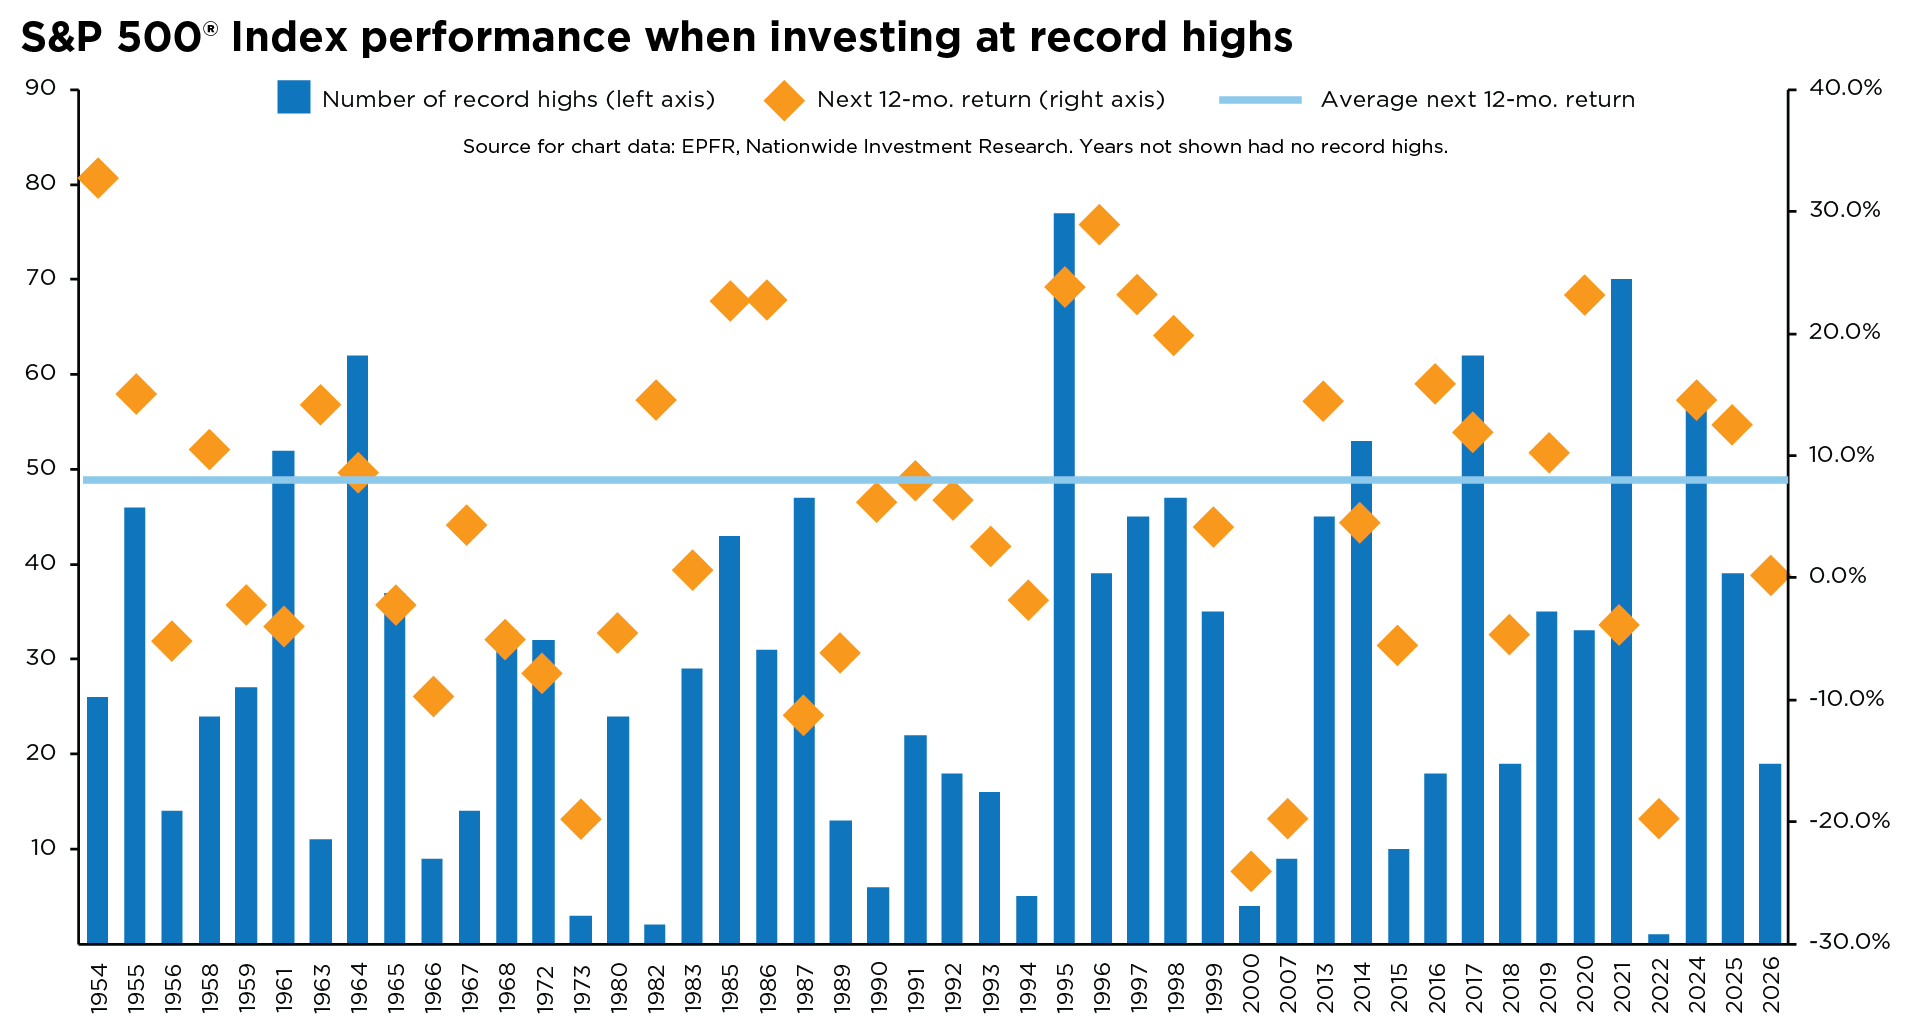
This track record also highlights an important nuance that can be lost to recency bias. A new all-time high for the S&P 500 neither guarantees further gains nor signals an imminent peak. Instead, it underscores a wide range of potential outcomes—where forward returns can vary meaningfully, even as the overall bias remains to the upside, as reflected in the average forward return of roughly 10% (see chart).
Investors should view all-time highs as part of the market’s price discovery process, where expectations are continually recalibrated in response to evolving fundamentals and valuation dynamics, and the broader macro backdrop. In this environment, delaying investment decisions can quickly turn into market timing. A more effective approach is to maintain a disciplined, diversified rebalancing strategy—helping investors stay aligned with long-term goals.
Author(s)

Mark Hackett, CFA®, CMT®, CFP®
Chief Market Strategist, Nationwide Investment Management Group
Mark Hackett is the Chief Market Strategist for Nationwide’s Investment Management Group, bringing more than 20 years of experience in the asset management industry to the role.
Trending articles
In the coming years, more people will begin to think about the costs of health care in retirement and the possibility of needing long-term care (LTC) in the future, especially as the number of Americans reaching age 65 hits an all-time high this year.
Considerations for financial professionals on supporting retirees through economic uncertainty.
This guide explores strategies for securing long-term care for children with special needs through special needs trusts, ABLE accounts, and government benefits.