Mark Hackett, CFA®, CMT®, CFP®


Markets and economy
Markets and economy
Staying invested in a midterm year:
what history suggests
Key Takeaways:
- While midterm election years have historically been marked by heightened volatility and deeper drawdowns, this year’s market has largely defied that pattern.
- History suggests that disciplined investors are often rewarded for staying diversified and invested, as the S&P 500® Index has never been lower one year after a midterm election since 1950.
10/28/2026 — It’s been an eventful month for the stock market, with volatility surging, leadership shifting, and credit spreads widening in October. Despite the uncertainty, the S&P 500® Index has continued to defy expectations, holding in a narrow range just below its all-time high.
This uneasy equilibrium may not last indefinitely. The recent rotation out of AI stocks has underscored how quickly market leadership can shift. Investors will soon face another potential catalyst for volatility as the midterm elections draw near.
In a recent Nationwide Retirement Institute® survey, investors expressed a desire for guidance on what the election could mean for their portfolios. Nearly three-quarters (73%) of those surveyed are looking for help to understand the financial effects of the midterms.
Historically, midterm election years have brought heightened volatility and larger-than-average drawdowns as investors grapple with uncertainty about the political path ahead. But this midterm season has largely defied that pattern, with far fewer meaningful pullbacks than the historical record would suggest.
Earlier this year, the S&P 500 fell 9.1% as geopolitical concerns rattled investor sentiment and positioning. Yet the market has remained remarkably resilient despite ongoing uncertainty around geopolitics, inflation, monetary policy, and artificial intelligence.
Rather than following the choppy path historically associated with midterm election years, equities have outperformed seasonal norms with relatively few pullbacks, supported by healthy economic activity and continued investment in artificial intelligence. While volatility could increase ahead of the midterms, history suggests the backdrop becomes increasingly constructive after the election.
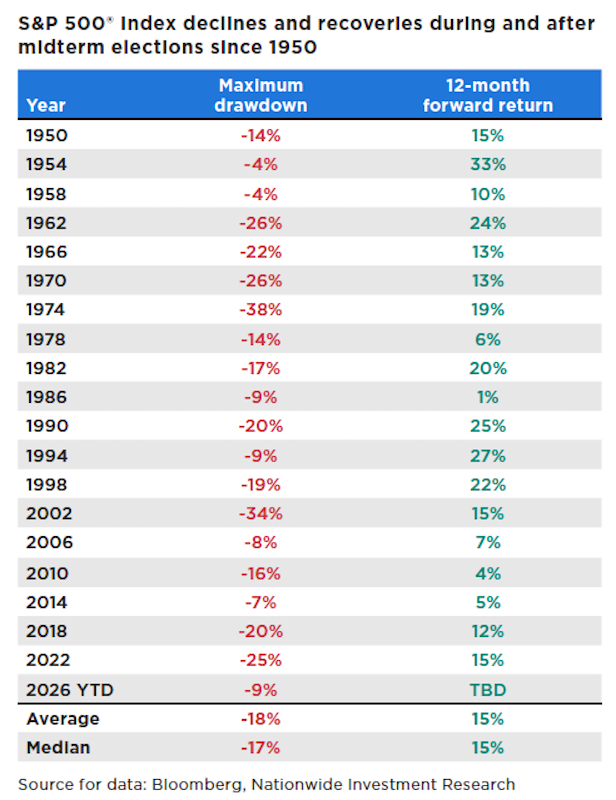
Many investors are waiting for the midterms to serve as a clearing event for market volatility. As the accompanying table shows, midterm election years have historically featured deeper intra-year drawdowns, with the average peak-to-trough decline reaching roughly 18%. That compares with an average intra-year drawdown of about 14% across all calendar years since 1950.
Based on historical averages, investors may be tempted to move to the sidelines to avoid midterm election-related volatility. But trying to time the market can have costly implications for long-term portfolio performance. Encouragingly, history suggests that staying diversified and invested through periods of uncertainty is often the more prudent approach.
Looking at forward returns, the S&P 500 has never been lower one year after a midterm election since 1950. Narrowing the lens further, the Index has also posted positive returns 100% of the time during the six months following a midterm election.
That said, investors should recognize that while history can be informative, it offers no guarantees about future outcomes. Still, the historical record provides a reassuring reminder that disciplined investors are often rewarded for staying focused on their long-term plan rather than reacting to political headlines as the election approaches.
Author(s)

Mark Hackett, CFA®, CMT®, CFP®
Chief Market Strategist, Nationwide Investment Management Group
Mark Hackett is the Chief Market Strategist for Nationwide’s Investment Management Group, bringing more than 20 years of experience in the asset management industry to the role.
Trending articles
What could matter most for bond investors in 2026? Income, flexibility, and a disciplined approach to security selection.
As sports betting gains popularity, investors may blur the line between gambling and investing. Here's why time and compounding matter.
Looking beyond rates reveals what's historically fueled small-cap gains most: stronger earnings and a growing economy.
Disclaimers
This material is not a recommendation to buy or sell a financial product or to adopt an investment strategy. Investors should discuss their specific situation with their financial professional.
Except where otherwise indicated, the views and opinions expressed are those of Nationwide as of the date noted, are subject to change at any time and may not come to pass.
S&P 500® Index: An unmanaged, market capitalization-weighted index of 500 stocks of leading large-cap U.S. companies in leading industries; it gives a broad look at the U.S. equities market and those companies’ stock price performance.
S&P Indexes are trademarks of Standard & Poor’s and have been licensed for use by Nationwide Fund Advisors. The Products are not sponsored, endorsed, sold or promoted by Standard & Poor’s and Standard & Poor’s does not make any representation regarding the advisability of investing in the Product.