Mark Hackett, CFA®, CMT®, CFP®


Markets and economy
Markets and economy
Why are small caps outperforming?
Look beyond interest rates
Key takeaways:
- Across multiple interest rate cycles, leadership has shifted between large- and small-cap stocks with little regard for the direction of policy rates.
- If earnings continue to strengthen, smaller companies could be well positioned to participate in a broadening market advance.
08/25/2026 – The recent outperformance of small-cap stocks has been impressive because it has occurred amid two crosscurrents many investors consider unfavorable for the asset class: rising U.S. Treasury yields and a more hawkish Federal Reserve. Conventional wisdom suggests these factors should weigh more heavily on smaller companies than on larger ones. Yet despite these headwinds, small caps have quietly moved higher.
Smaller companies are often viewed as more dependent on external financing and more vulnerable to higher borrowing costs, leading many investors to believe small caps should struggle during periods of rising interest rates. Yet history offers little evidence that interest rates alone have consistently determined the relative performance of small- and large-cap stocks.
Across multiple tightening and easing cycles, leadership has shifted between large- and small-cap stocks with little regard for the direction of policy rates. Perhaps that's because investors have confused a symptom with a cause: higher rates often accompany stronger economic growth, improving business activity, and accelerating corporate profits. In other words, the Fed often raises rates because the economy is strengthening, not in spite of it.
Focusing exclusively on interest rates risks overlooking the factor that has historically mattered most for small-cap returns: earnings growth and economic resilience. Consensus estimates show earnings per share for the Russell 2000® Index growing at nearly twice the rate of the S&P 500® Index this year and next.
This distinction is especially relevant today. Earnings growth has broadened beyond the narrow group of mega-cap companies that drove market leadership over the past several years. Earnings revisions for smaller companies have improved in 2026, participation has expanded across industries, and economic activity, including manufacturing, has remained resilient despite pockets of weakness. The result is a market increasingly willing to reward a broader set of businesses across market capitalizations and investment styles.
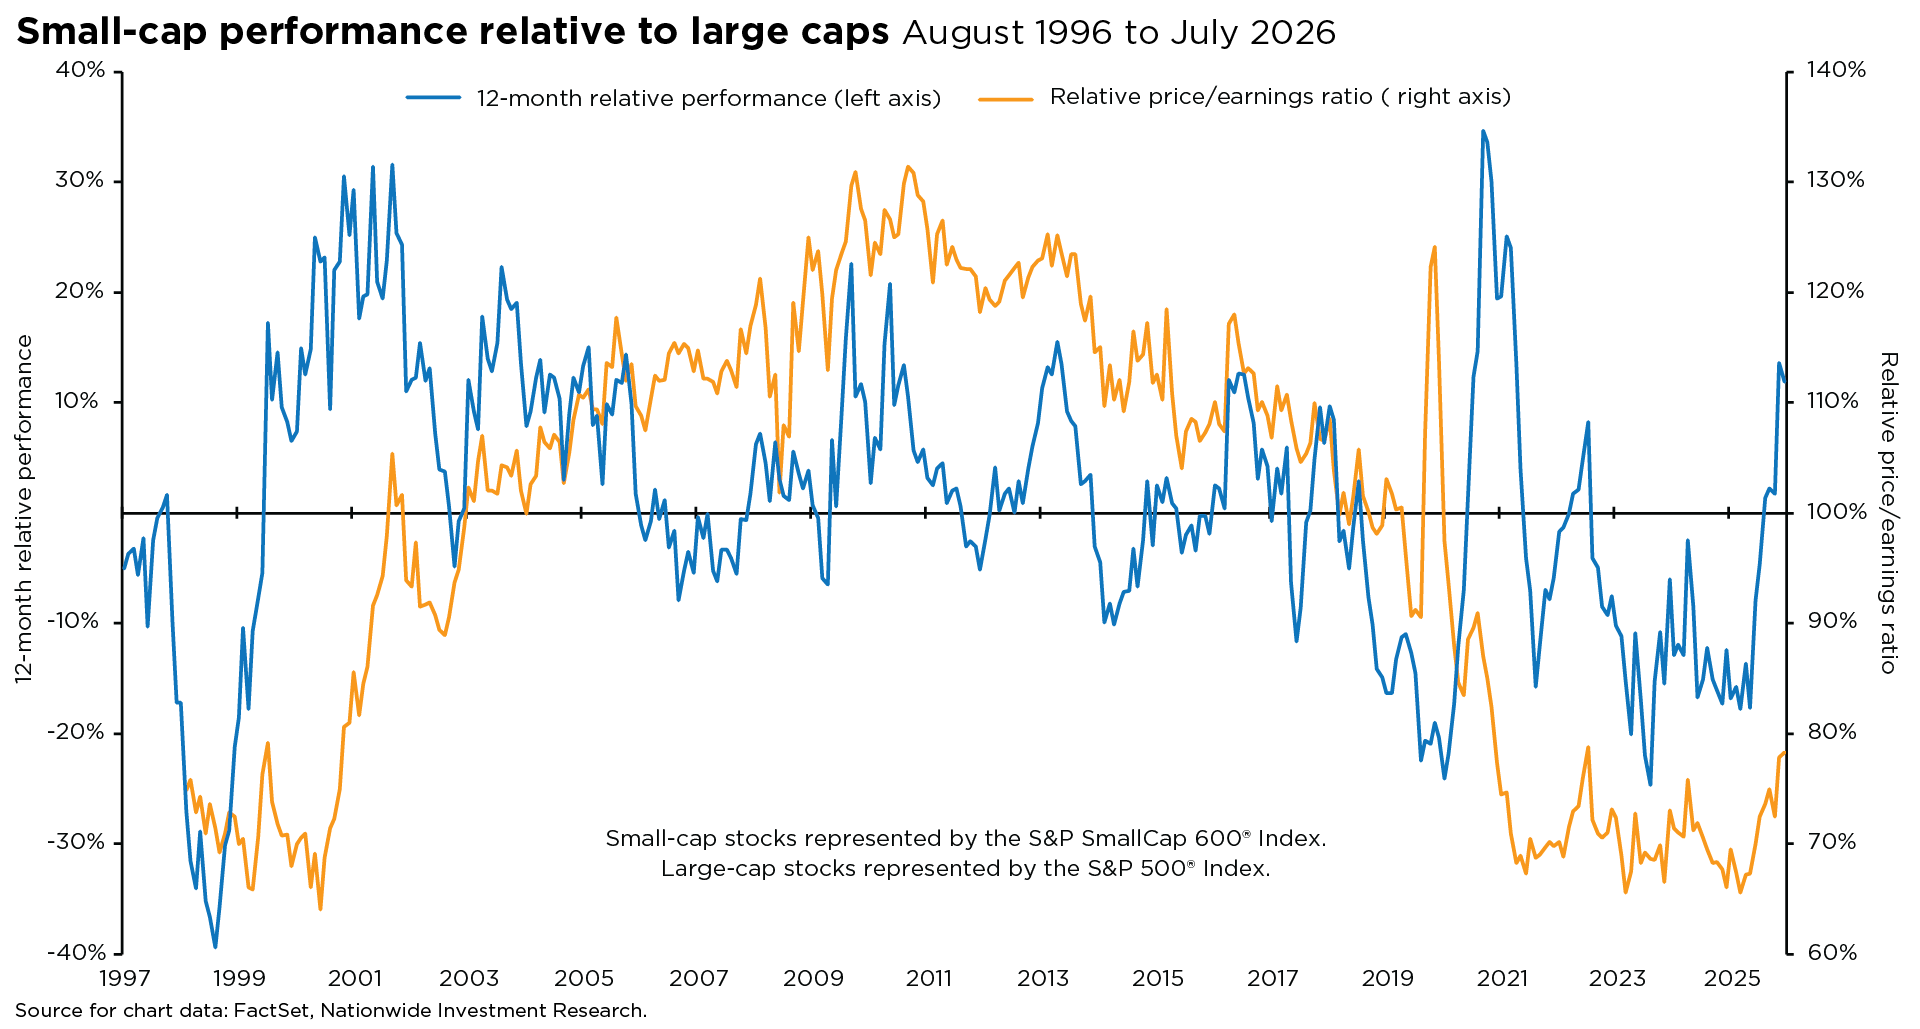
While many investors have drawn parallels between today's market and the late stages of the dot-com era, a more instructive comparison may lie within small caps themselves. Leading up to the technology bubble's peak in 2000, small caps, as measured by the S&P SmallCap 600® Index, endured a prolonged period of relative underperformance and traded at a historically wide valuation discount to the S&P 500. (See chart.)
Yet as market leadership broadened, the narrative shifted dramatically. From 2000 through 2007, small caps outperformed the S&P 500 in each year, by an average of roughly 11% annually. Extending the horizon further, small caps outperformed in 10 of the 11 years from 2000 to 2010, by an average of about 8% per year. This episode serves as a reminder that periods of extreme concentration and persistent relative underperformance often sow the seeds of future leadership.
Author(s)

Mark Hackett, CFA®, CMT®, CFP®
Chief Market Strategist, Nationwide Investment Management Group
Mark Hackett is the Chief Market Strategist for Nationwide’s Investment Management Group, bringing more than 20 years of experience in the asset management industry to the role.
Trending articles
What could matter most for bond investors in 2026? Income, flexibility, and a disciplined approach to security selection.
As sports betting gains popularity, investors may blur the line between gambling and investing. Here's why time and compounding matter.
Looking beyond rates reveals what's historically fueled small-cap gains most: stronger earnings and a growing economy.
Disclaimers
This material is not a recommendation to buy or sell a financial product or to adopt an investment strategy. Investors should discuss their specific situation with their financial professional.
Except where otherwise indicated, the views and opinions expressed are those of Nationwide as of the date noted, are subject to change at any time and may not come to pass.
Russell 2000® Index: An unmanaged index that measures the performance of the small-capitalization segment of the US equity universe.
Russell Investment Group is the source and owner of the trademarks, service marks and copyrights related to the Russell Indexes. The Fund is not sponsored, endorsed, or promoted by Russell, and Russell bears no liability with respect to any such funds or securities or any index on which such funds or securities are based. Russell ® is a trademark of Russell Investment Group.
S&P 500® Index: An unmanaged, market capitalization-weighted index of 500 stocks of leading large-cap US companies in leading industries; it gives a broad look at the US equities market and those companies’ stock price performance.
S&P SmallCap 600® Index: A stock market index established by Standard & Poor's that covers roughly the small-cap range of American stocks, using a capitalization-weighted index.
S&P Indexes are trademarks of Standard & Poor’s and have been licensed for use by Nationwide Fund Advisors. The Products are not sponsored, endorsed, sold or promoted by Standard & Poor’s and Standard & Poor’s does not make any representation regarding the advisability of investing in the Product.