Market dispersion is back—why stock selection matters more now
Key takeaways:
- Correlations among stocks in the S&P 500 have fallen in recent months, while return dispersion has widened sharply—driven by a growing gap between the best- and worst-performing stocks.
- Widening dispersion and persistently low correlations point to a market where selectivity matters and active management may have greater scope to add value beyond benchmark returns.
04/02/2026 – For months, the S&P 500® Index has been grinding through a pattern of lower highs alongside repeated VIX flare-ups, sharp sector and factor rotations, and elevated interest-rate volatility. The collision of these dynamics has left many investors conflicted over whether the market is attempting to carve out a more durable bottom amid a shifting geopolitical backdrop, or whether the recent downdrift marks the early stages of something more concerning.
Lost amid this debate is a more nuanced story unfolding beneath the Index level: correlations among stocks in the S&P 500 have fallen meaningfully. The 63-day stock-to-Index correlation now sits roughly 1.5 standard deviations below its long-term average, signaling that stocks are no longer moving as a herd. Longer-term measures tell a similar story, with the 126-day correlation hovering near levels last observed in the aftermath of the 2000 tech bubble—underscoring the magnitude of today’s correlation breakdown.
The breakdown is evident at the sector level as well. Ten of the eleven S&P 500 sectors currently sit below their long-term correlation averages, led by growth-oriented areas such as technology, communication services, and consumer discretionary. The divergence is even more pronounced among mega-cap leaders: the ‘Magnificent 7’ have meaningfully diverged from the broader market, with the 100-day correlation between the Mag 7 and the S&P 500® Equal Weight Index falling to –0.27, the most negative reading since June 2023. In short, equities are increasingly moving in opposite directions, creating a more compelling environment for stock selection.
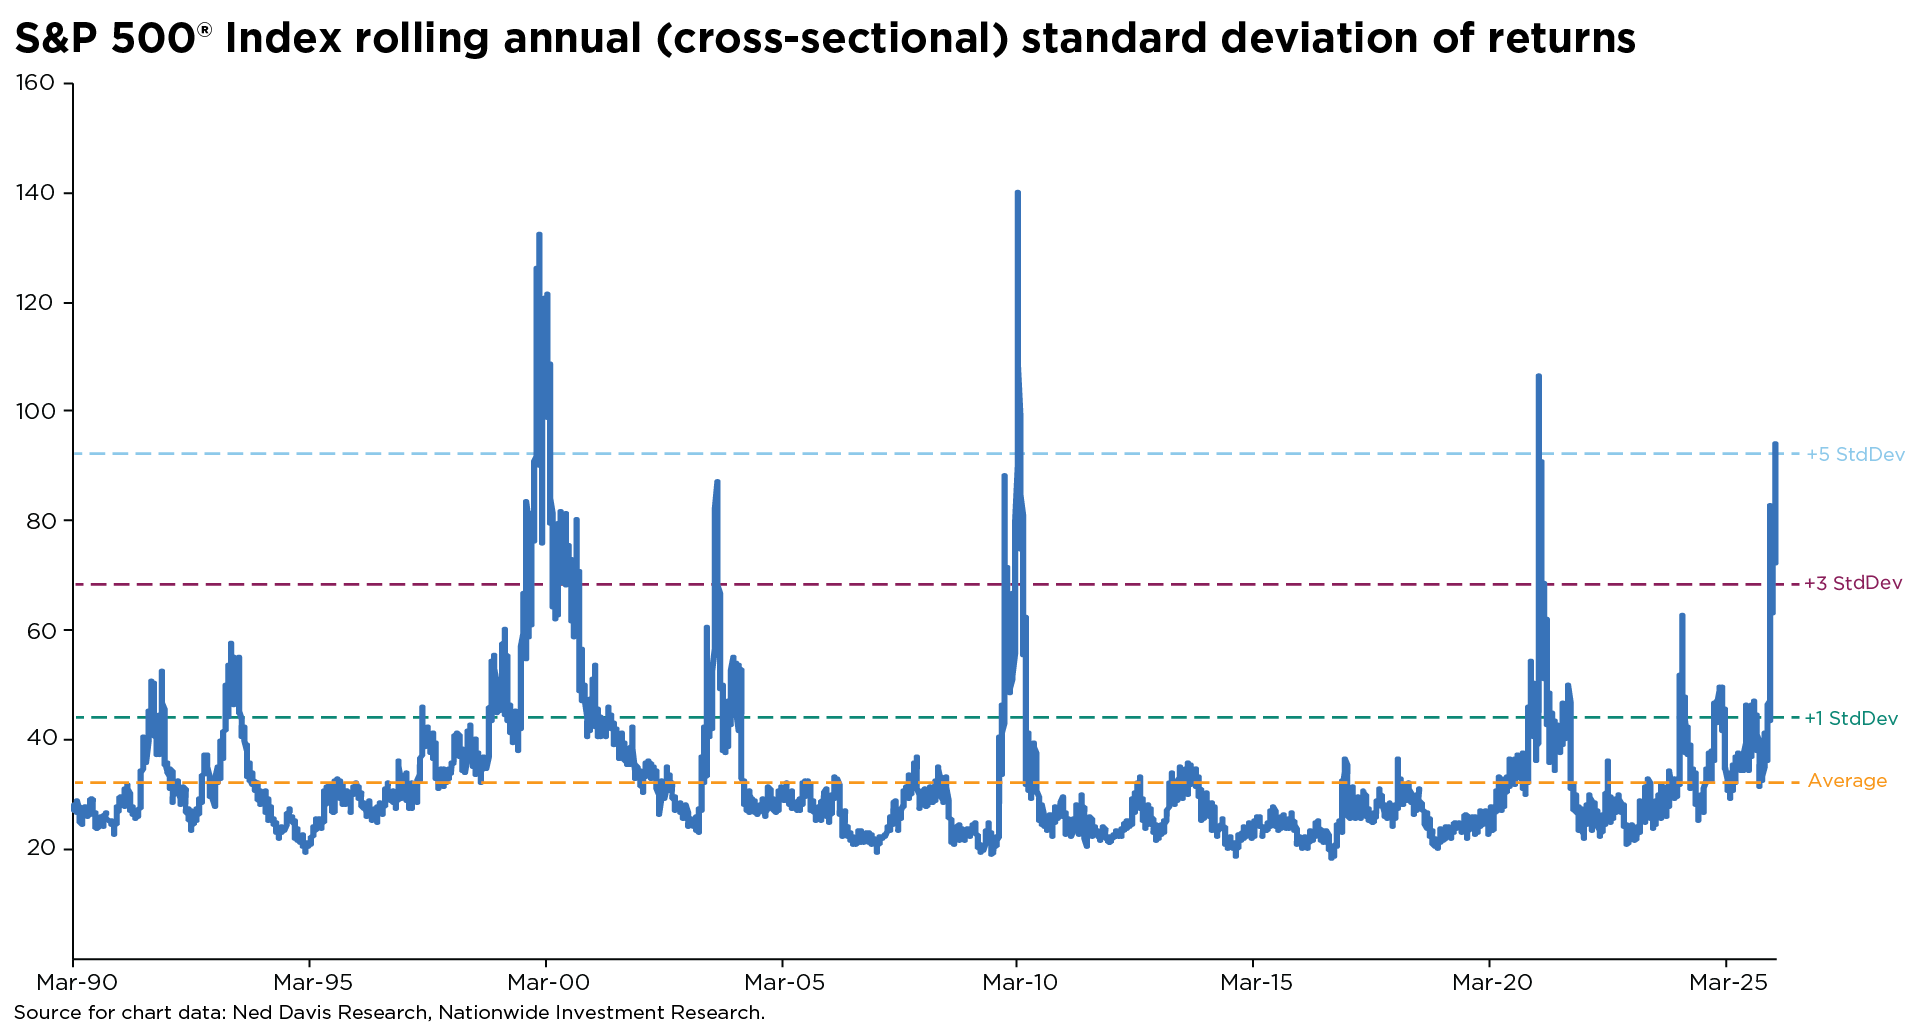
Adding to this fragmentation, return dispersion has surged to unusually elevated levels. The gap between the best- and worst-performing stocks in the S&P 500 has widened so dramatically that cross-sectional volatility now sits more than five standard deviations above its long-term average. Statistically, that represents a roughly one-in-two-million outcome—an extreme reached only in the aftermath of the dot-com bust, the financial crisis, and the COVID shock. (See the accompanying chart.)
While sector-level dispersion remains within historical norms, that stability is misleading. At the sub-industry level, performance gaps have widened sharply, revealing that sector averages are masking meaningful divergences beneath the surface.
With sentiment and positioning largely aligned, the S&P 500 may appear calm on the surface, but the real story continues to unfold underneath. Together, widening dispersion and persistently low correlations point to a market where selectivity matters—and where active management may have greater scope to add value beyond benchmark returns.
Author(s)

Mark Hackett, CFA®, CMT®, CFP®
Chief Market Strategist, Nationwide Investment Management Group
Mark Hackett is the Chief Market Strategist for Nationwide’s Investment Management Group, bringing more than 20 years of experience in the asset management industry to the role.
Trending articles
In the coming years, more people will begin to think about the costs of health care in retirement and the possibility of needing long-term care (LTC) in the future, especially as the number of Americans reaching age 65 hits an all-time high this year.
Considerations for financial professionals on supporting retirees through economic uncertainty.
This guide explores strategies for securing long-term care for children with special needs through special needs trusts, ABLE accounts, and government benefits.