Loading...
Summary: Rethinking tax planning in retirement
How strategic withdrawals, paired with protected income, can drive better outcomes for clients
- Instead of focusing exclusively on this year's tax brackets, financial professionals can add value by introducing the idea of the effective marginal rate (EMR) to reveal the impact of each additional dollar withdrawn in retirement from a tax-deferred account
- Using the EMR to guide withdrawal strategies over a lifetime can significantly improve retirement outcomes and lower the lifetime tax burden
- Aligning retirement income strategies with retiree preferences enhances success
- Research shows that 65% of retirees prefer a level of protected income1 to help cover their essential spending needs
Financial professionals today are commonly working with pre-retirees who have accumulated a large amount of savings in a variety of (mostly tax-deferred) vehicles: IRAs, 401(k)s, 457s, 403(b)s, health savings accounts, taxable brokerage accounts, and insurance products. A central question for people on the cusp of retirement is how to turn those savings into income. Financial professionals can tailor their recommendations and provide greater value by considering both tax implications and unique client preferences for income protection as they construct strategies.
Many clients use an inefficient withdrawal strategy
The full-length version of this article features a hypothetical couple, John and Jane, both age 65, with some specific savings and Social Security benefits assumed. The base case shows them choosing this common method of generating retirement income:
- Claim Social Security benefits immediately upon retirement.
- Supplement with withdrawals from the brokerage account.
- When the time comes, RMDs will provide supplemental income.
Outcome: At death, the after-tax value of their portfolio is $2.27 million.
A more tax-efficient approach to retirement withdrawals
- Delay claiming Social Security benefits.
- Blend withdrawals from taxable, tax-deferred and Roth accounts.
- Utilize Roth conversions to reduce RMDs.
Outcome: At death, the after-tax value of their portfolio is more than $3 million.
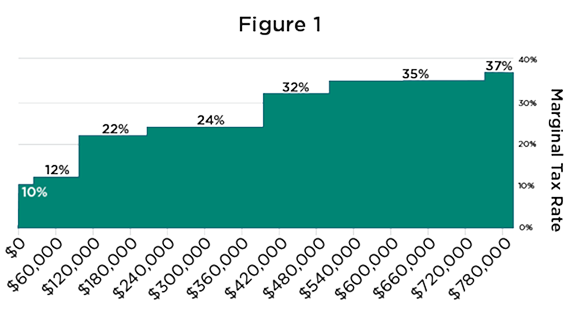
Figure 1: Tax map depiction of the ordinary income brackets
At the company I founded, Covisum, we created a proprietary way to graph tax brackets, which we call a tax map. In Figure 1, I display the tax map of the brackets for a married couple filing jointly (MFJ):
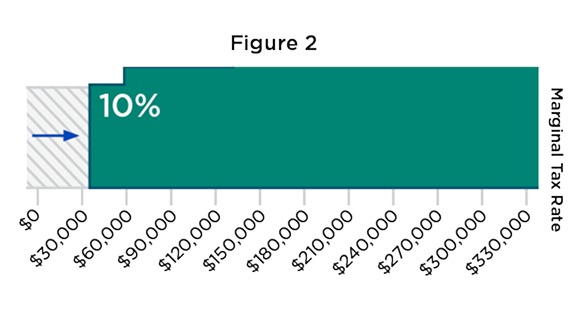
Figure 2: Tax map that reflects the MFJ deduction
The 2025 tax legislation, known as the One Big Beautiful Bill Act (OBBBA), increased the standard deduction to $32,200 for married couples filing jointly. When we incorporate the standard deduction, the tax map shifts to the right.
Figure 2 shows that a married couple filing jointly would not experience any tax at all on their income below $32,200. The first dollar that exceeds $32,200 would experience a 10% rate. When total ordinary income exceeds $57,000, only the income that exceeds the threshold is taxed at the 12% rate.
For people over 65, the map shifts even further to the right. First, people who are over 65 or blind receive an additional $1,650 deduction each if they are married filing jointly or $2,050 if filing single or as head of household. This provision was unchanged by the OBBBA. The OBBBA also introduced a new temporary additional senior deduction of up to $6,000 for single or head of household and up to $12,000 for married filing jointly where both members of the couple are 65 or older. Given these additional deductions, our couple, John and Jane, could take $47,500 from their IRA and pay no federal income tax on the withdrawal, assuming that’s the only ordinary income on their tax return.
Figure 3: Hypothetical example of a tax map showing Effective Marginal Rate
If IRA withdrawals were all we needed to consider from a tax perspective, tax-efficient planning would be easy. We would simply target our withdrawals to fill a targeted tax bracket and be done. But not all income is taxed as ordinary income, and the ordinary income tax bracket rates are not the only taxes in our tax system.
A better way to represent taxation is a tax map that shows the change in IRA withdrawal across the X axis and the corresponding tax rate on each withdrawn dollar in gray, after accounting for the IRA dollar’s impact on other incomes and deductions. Figure 3 is a common example of a tax map for another hypothetical retired couple age 65+. They have $60,000 of combined Social Security benefits and $30,000 of long-term capital gains. The map starts at $0 of ordinary income on the left and demonstrates the Effective Marginal Rate (EMR) as we move to the right.
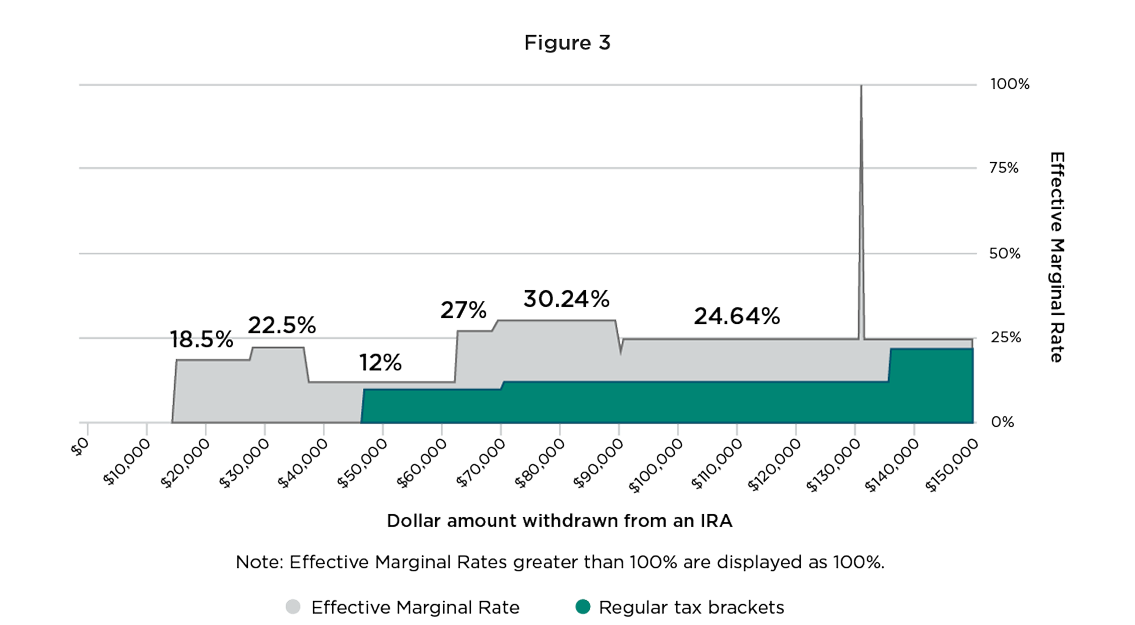
- At roughly $15,000 of IRA withdrawals, this couple begins to experience an 18.5% EMR on each dollar withdrawn from the IRA, because $1 of IRA income makes 85 cents of a Social Security dollar taxable that would have been tax-free in the absence of the IRA withdrawal. $1.85 is taxed at 10%, creating 18.5 cents of tax that would not have been present in the absence of the additional dollar of IRA withdrawal.
- The same concept applies to 22.2%, but in this case, the $1.85 is taxed at 12%.
- The rate on each dollar withdrawn from the IRA then drops back to 12% because the full 85% of Social Security benefits has become taxable.
- The full-length article explains the other ups and downs of the Effective Marginal Rate.
Further distortions of our basic tax system abound
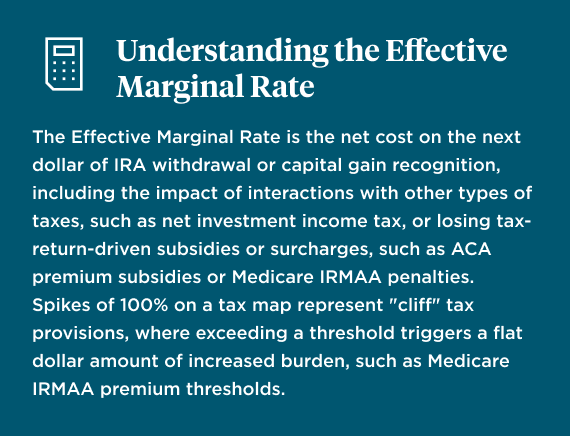
Between net investment income tax (NIIT), IRMAA surcharges, the phaseout of subsidies for ACA health insurance coverage, alternative minimum tax and additional phaseout provisions on state and local tax deductions, tips, and overtime — and with little doubt that more distortions could emerge in the future — retirees need to be aware that the bracket rate is not the rate that matters for planning purposes. Instead, retirees should focus on the Effective Marginal Rate. The EMR is the net impact of government action on the last dollar withdrawn from an account. Tax maps allow us to recognize that impact.
Projecting tax maps through a retiree’s lifetime can provide a more meaningful method for determining targeted withdrawal amounts from an IRA than looking to the marginal tax bracket.
Retirement income preferences
Tax efficiency is only part of the story. Creating a strategy that sticks can be better achieved when you understand each client's unique preference for protected income in retirement.
A recent area of groundbreaking research in retirement income by Wade Pfau and Alex Murguia is focused on the idea that a retirement income strategy is valuable to the extent that the retiree can stick to that strategy over their full retirement horizon. Pfau and Murguia’s research revealed that about 2 of 3 Americans would prefer some element of protection in their retirement income strategy,1 commonly through the use of annuities.
Marrying tax efficiency with protected income in practice can have interesting implications. Protected income generally requires some level of commitment and structure. As a result, determining the plan for account usage within a tax-efficient framework first can inform the timing and the accounts in which protected income should be purchased. The full-length version of this article names retirement income strategies and identifies clients for whom they may be suitable.
The complete article explores 4 scenarios for our hypothetical couple, John and Jane
These scenarios are intended to demonstrate a variety of ways that preferences for protected retirement income may be incorporated into a tax-efficient overall retirement income strategy. Such a strategy starts with a plan to optimize Social Security benefits, then uses the tax properties of various accounts to produce better outcomes, ultimately choosing investment and insurance products based on when and how they will be used through the course of the retirement.
In their article Guaranteed Income: A License to Spend, David Blanchett and Michael Finke summed up this consumer reaction to having protected income: “We explore how the composition of retirement assets is related to retirement spending and find that retirees who hold a higher percentage of their wealth in guaranteed income spend more than retirees whose wealth consists primarily of non-annuitized assets. Retirees will spend twice as much each year in retirement if they shift investment assets into guaranteed income wealth.”
Conclusion: Pursue tax efficiency, incorporate client preferences and consider protected income
Financial professionals who incorporate tax efficiency and protected income for their clients stand to grow their business and differentiate themselves as retirement income specialists.